
- (Introduction)
- Surface gravity wave has an important impact on coastal structures and sediment transport in coastal regions.
- Since in-situ observations are not sufficient to confirm the impact of waves, it is necessary to evaluate the accuracy of wave models for coastal management.
• This study evaluates the accuracy of wave models provided for Gyeonggi Bay, which is characterized by macro-tidal, shallow water, and complex bathymetry, and suggests requirements for improving the accuracy.
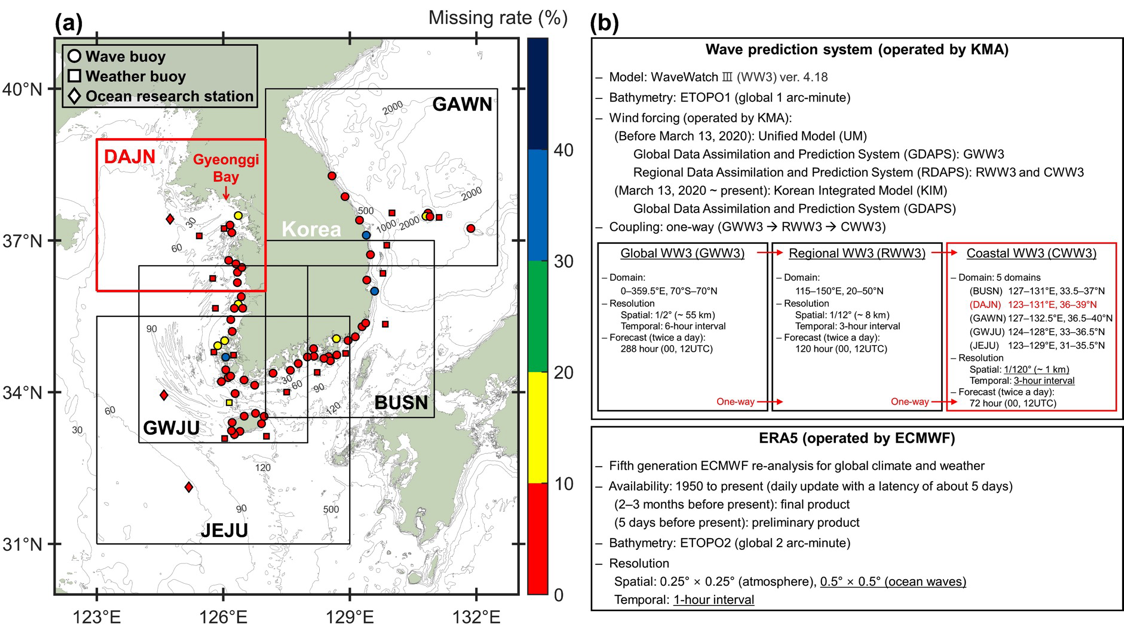
(a) Bathymetry contours (m), wave model, and observation system are shown, along with the locations of 3 ocean research stations (3 diamonds) and 75 buoys (17 triangles: weather buoy, 58 circles: wave buoy), and 5 model domains of Coastal Wave Watch III (CWW3) (1 red square bounding box; DAJN: Dajeon and 4 black square bounding boxes; BUSN: Busan, GAWN: Gangwon, GWJU: Gwangju, and JEJU: Jeju). The ocean research stations were operated by Korea Hydrographic and Oceanographic Agency (KHOA). The buoys and CWW3 were operated by Korea Meteorological Administration (KMA). The color of the marks (diamonds, squares, and triangles) denotes the missing rate of wave observations at each point during 2019-2021. (b) Wave modeling system operated by KMA and ERA5 operated by the European Centre for Medium-Range Weather Forecasts (ECMWF).
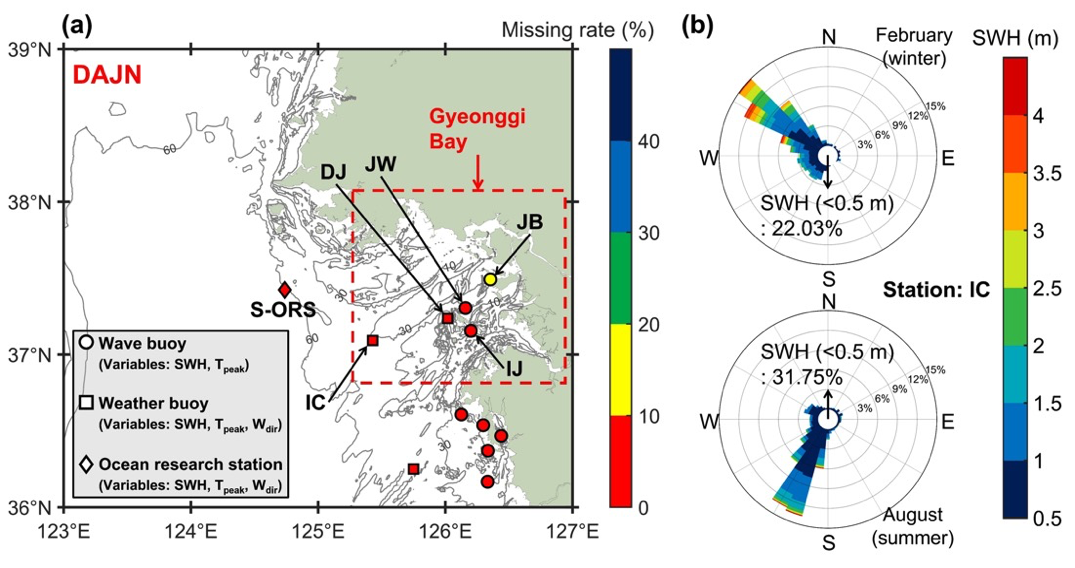
(a) Bathymetry contours (m) and model domain of DAJN CWW3, 5 buoys (DJ: Duckjuckdo weather buoy, IC: Incheon weather buoy, JW: Jawoldo wave buoy, IJ: Ijakdo wave buoy, and JB: Jangbongdo wave buoy) located in Gyeonggi Bay, and 1 ocean research station (S-ORS: Socheongcho ocean research station) located offshore. (b) Rose diagram for wave based on February (winter) and August (summer) during 2019–2021 at IC. The bin width is 10° and the percentage indicates the portion of waves propagating in a specific direction. Arrows indicate the percentage of observed significant wave heights less than 0.5 m.
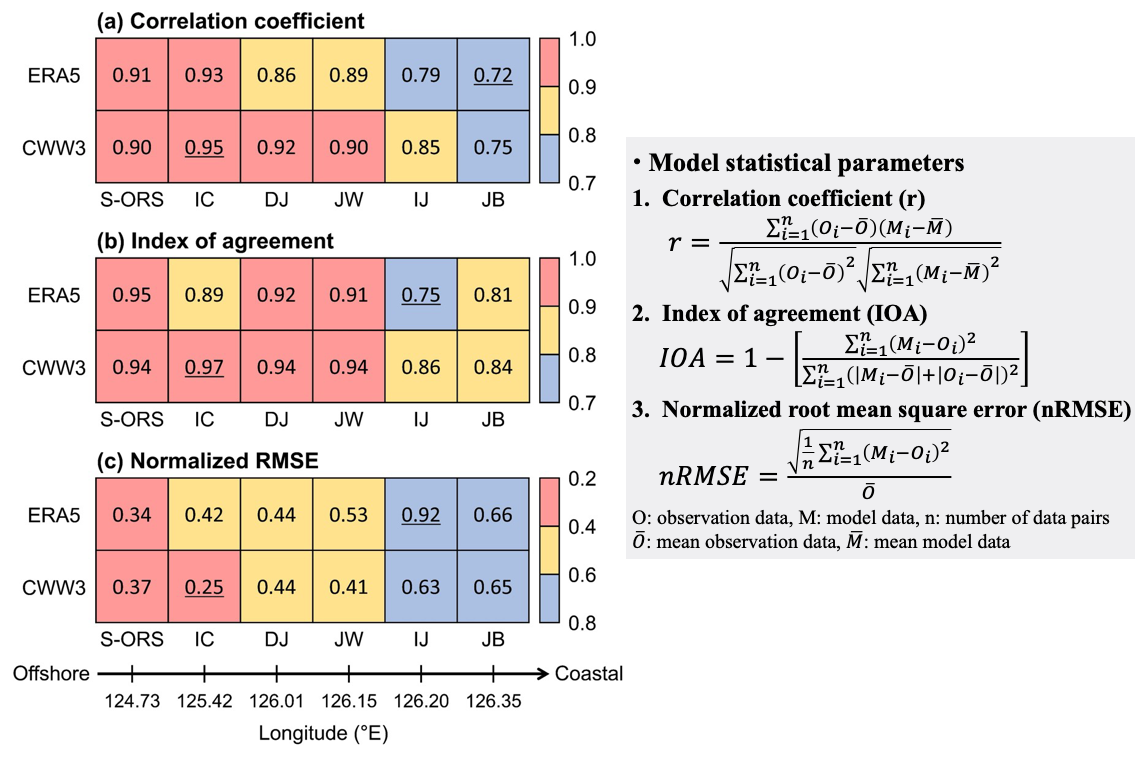
Accuracy evaluation of modeled significant wave heights (SWH) using three model statistical parameters; (a) correlation coefficient, (b) index of agreement, and (c) normalized root mean square error. The modeled SWH are from CWW3 and ERA5 wave datasets, and the result of statistical parameters at the nearest model grid node. The highest and lowest values are denoted by underlined text. The lower black arrow indicates the longitudes of observation points, ranging from offshore to coastal regions.
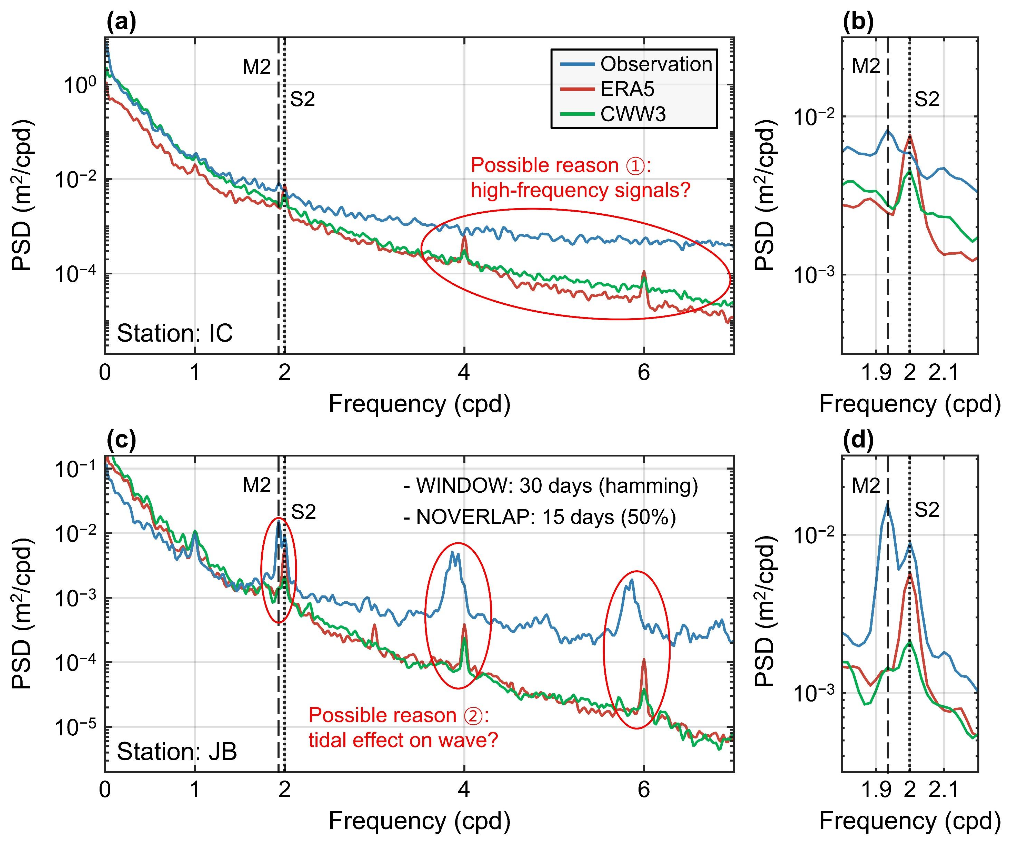
Power spectra of modeled and observed SWH at (a–b) Incheon weather buoy (IC) and (c–d) Jangbongdo wave buoy (JB). For spectral analysis, demeaned and detrended 3-year SWH are used, with a hamming window of 30 days and an overlap of 15 days applied. The vertical dashed lines indicate the semidiurnal tidal frequency of M2 (1.93 cycle per day, cpd) and S2 (2 cpd). (b and d) Power spectra of significant wave heights at IC and JB from 1.8 to 2.2 cpd for clarity.
(Summary)
• Both wave datasets (CWW3 and ERA5) showed good agreement with observed significant wave height at the Socheongcho ocean research station (S-ORS) and Incheon weather buoy (IC) located in offshore regions.
• However, the accuracy decreased in coastal regions, especially at the Jangbong wave buoy (JB).
• The results showed a high correlation between the model errors and the tidal cycle, especially the semidiurnal tidal frequency of M2 (1.93 cycles per day).
• These findings suggest that the tidal effects of the region should be taken into consideration to improve the accuracy of wave models in macro-tidal regions.
- 사업명
- 씨그랜트사업 5단계
- 발주처
- 해양수산부