
- Two scenario cases are simulated to analysis meltwater runoff impact.
• Svalbard archipelago located at gateway between North Atlantic Ocean and Artic Ocean. There is two major currents in west coast of Spitsbergen. 1) West Spitsbergen Current (WSC) : warm (>3.0°C) of Atlantic Water (AW) 2) Spitsbergen Polar Current (SPC) : cold (-1.5 to 1.0°C) of Arctic Water (ArW)
• The melting rate of tidewater glaciers on Arctic fjord coastlines has increased in recent decades (Vaughan et al., 2013; Huss and Hock, 2018). And the inflow of warm water from the outside of fjord can induce tidewater glaciers melting (Straneo and Heimbach, 2013; Sutherland et al., 2019).
• The inflow of WSC and SPC to the fjords can affected by various factors. Nilsen et al. (2016) suggested that the flow patterns are determined by bathymetry, while Cotteir et al. (2010) suggested that the horizontal density gradient have a significant impact on the inflow of warm water. Meltwater runoff can increase horizontal density gradient and it can change water exchange process.
• However, there is less study about the impact of meltwater runoff on water exchange between inner and outer fjord. Also, questions remain over how the internal circulation interacts with exchange mechanisms (Fraser, 2017).
• So, the objectives of this study are change in 1)the flow patterns inside the fjord, and 2)the volume transport processes between inner and outer fjords system due to the meltwater runoff using numerical modeling.
• Two scenario cases are simulated to analysis meltwater runoff impact. 1) Case1: Model scenario testcase which have meltwater runoff forcing from landward boundary. 2) Case2: Model scenario testcase which don’t have meltwater runoff forcing from landward boundary.
• Due to meltwater runoff, 1) (Spatial flow) Meltwater runoff weakens the anti-clockwise rotational flow that occur at the entrance to the fjord. 2) (Vertical distribution of velocity) The vertical flow during low runoff is a two-layer structure, whereas that shows a uniform direction in the entire column during high runoff period. 3) (Volume transport) When the runoff exceeds about 200 m3/s, the volume transport at bottom layer toward the fjord increased.
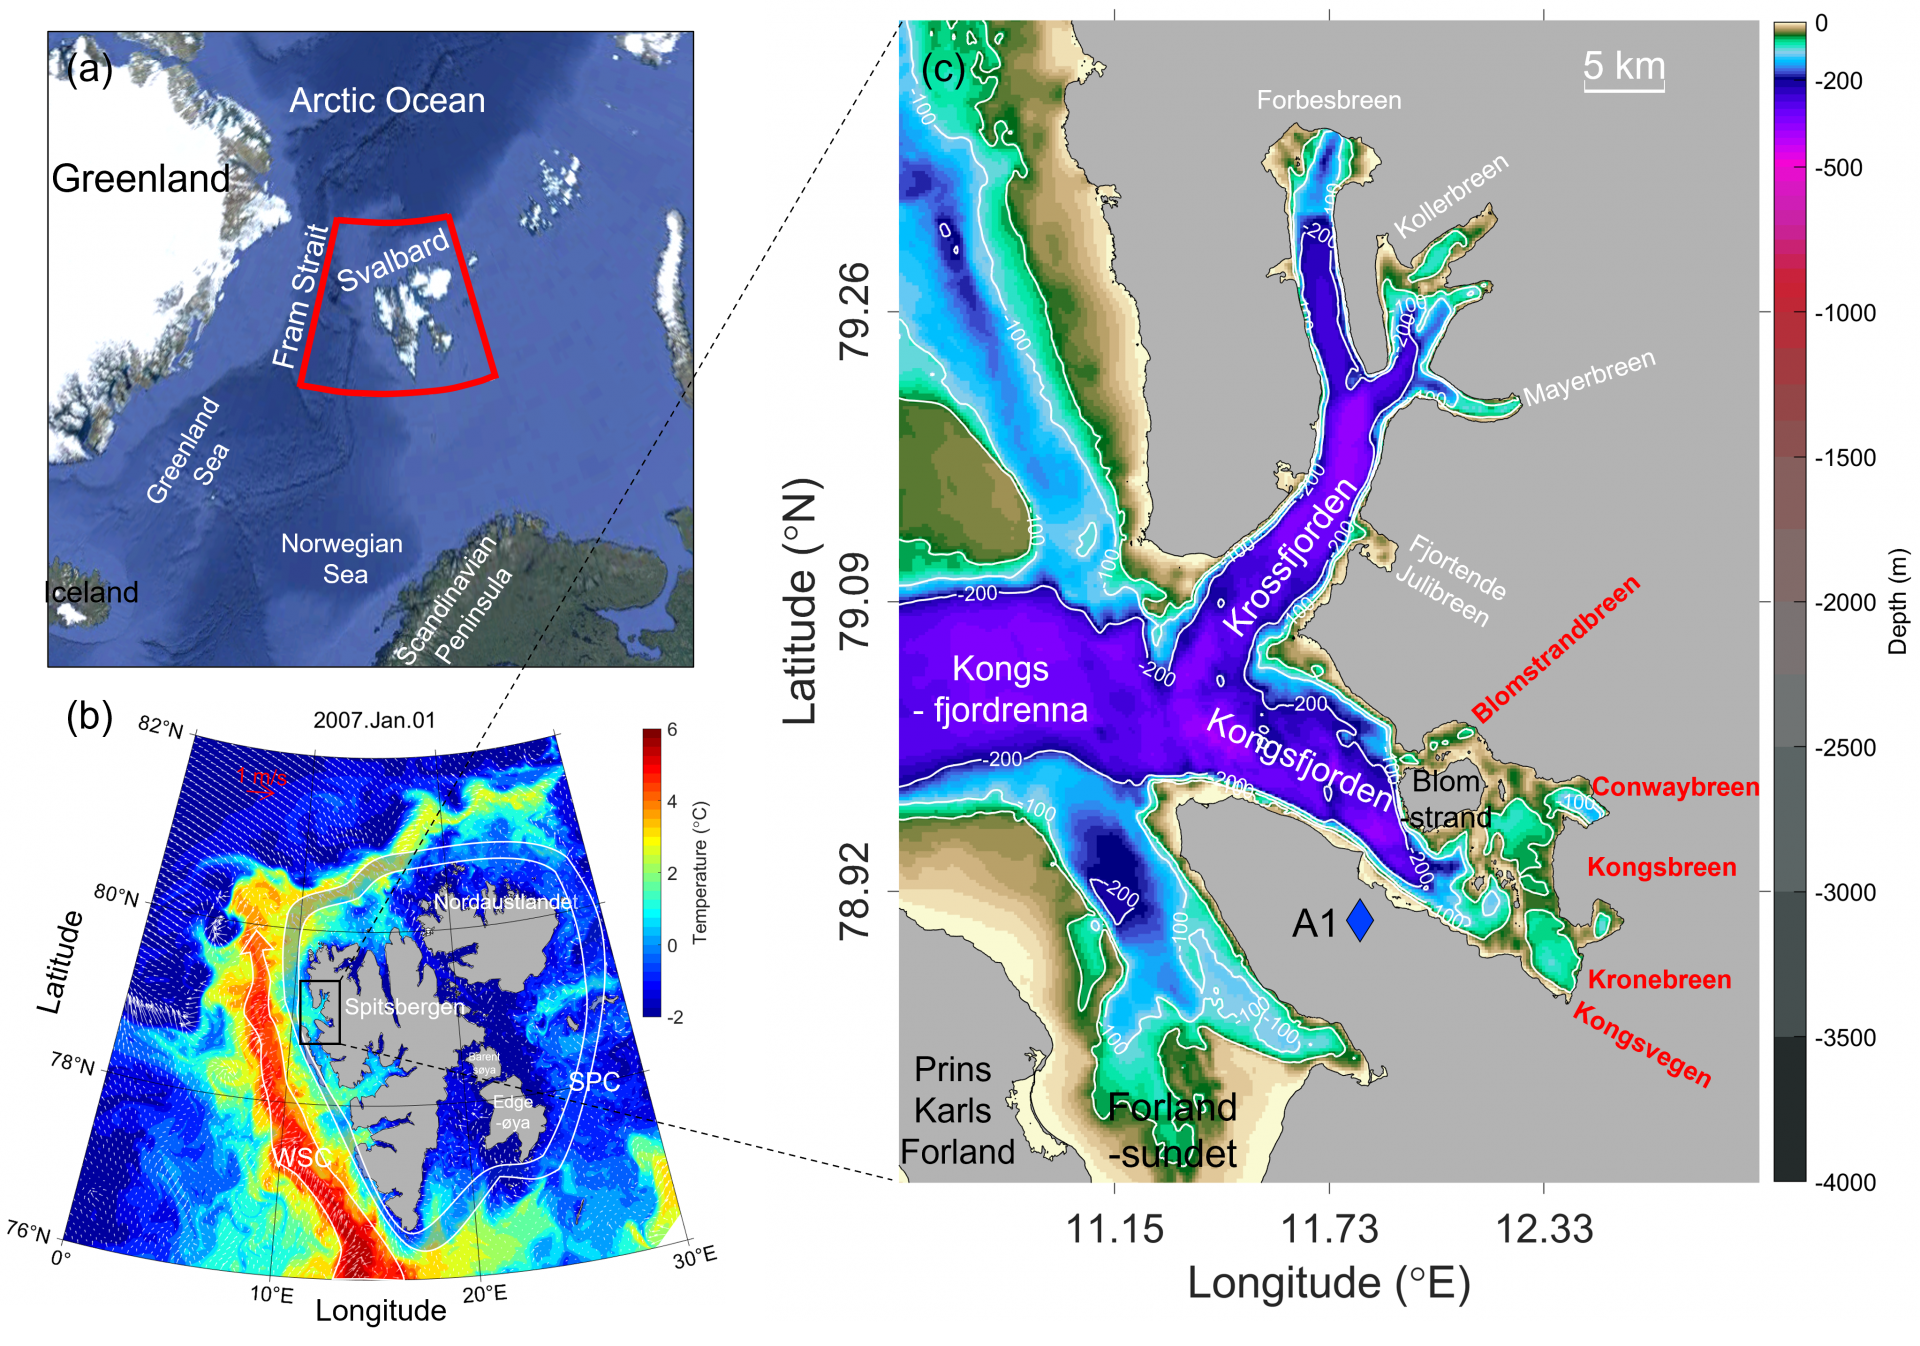
Figure 1. Map of Svalbard, showing Spitsbergen and Kongsfjorden. (a) Location of Svalbard. (b) Sea surface temperature (SST) distribution (color scale) from the S800 model result on January 1st, 2007, in the Svalbard coastal region. The northward-flowing West Spitsbergen Current (WSC) and Spitsbergen Polar Current (SPC) are illustrated by red and blue fields. White arrows indicate sea surface current vectors. (c) Bathymetry of the Kongsfjorden-Krossfjorden system (color scale) with 50, 100, and 200 m depth isobaths (white lines). The location of atmospheric observations (A1, blue diamond) is shown. White text indicates the locations of tidewater glaciers in Krossfjorden (Forbesbreen, Kollerbreen, Mayerbreen, and Fjortende Julibreen). Red text indicates the locations of five tidewater glaciers in Kongsfjorden (Blomstrandbreen, Conwaybreen, Kongsbreen, Kronebreen, and Kongsvegen).
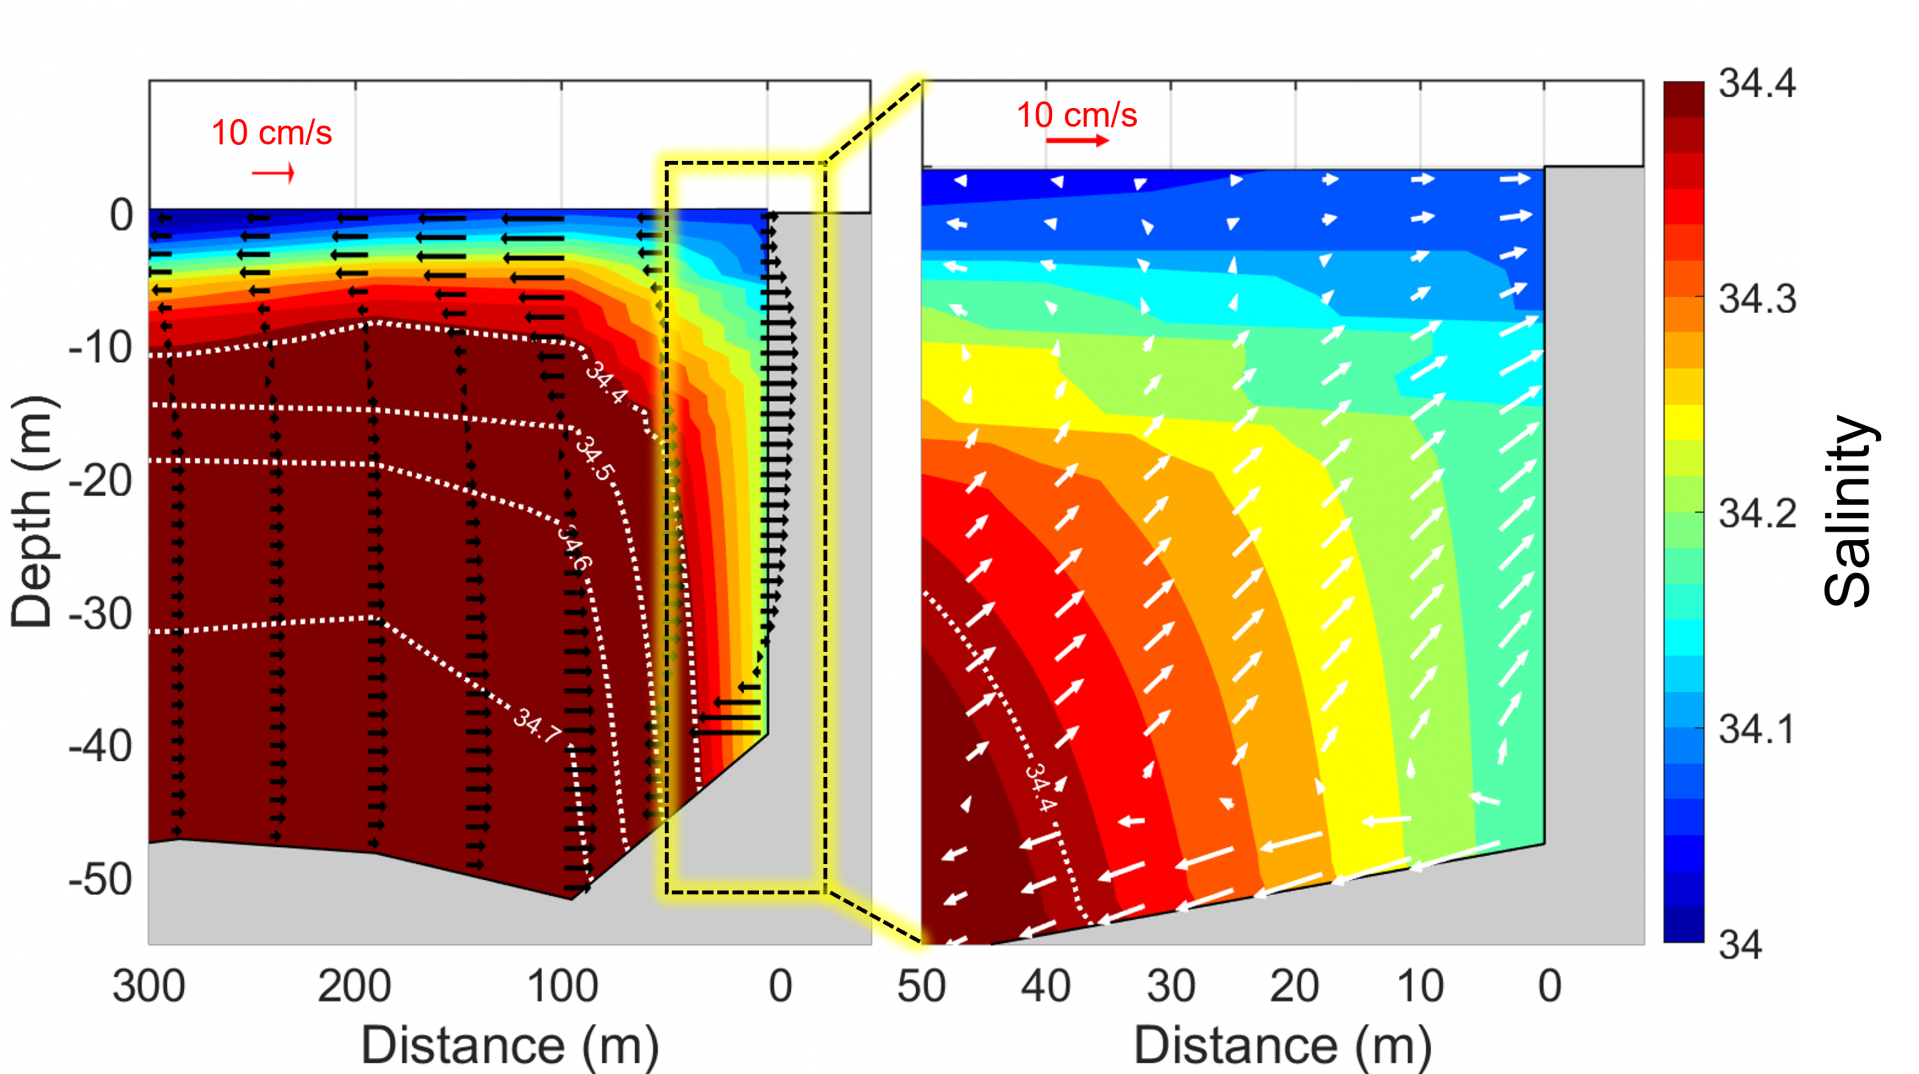
Figure 2. Salinity (color scale) and current distribution from the KO-FVCOM model results along the transect line starting from the meltwater sub-surface runoff point in front of Krb toward the ocean on July 10th, 2007 at 7 am. (a) Horizontal along-transect current (black arrows) at all vertical layers (35 layers). (b) Along-transect current with vertical direction (white arrows) at odd-numbered layers (1st layer-surface to 35th layer-bottom).
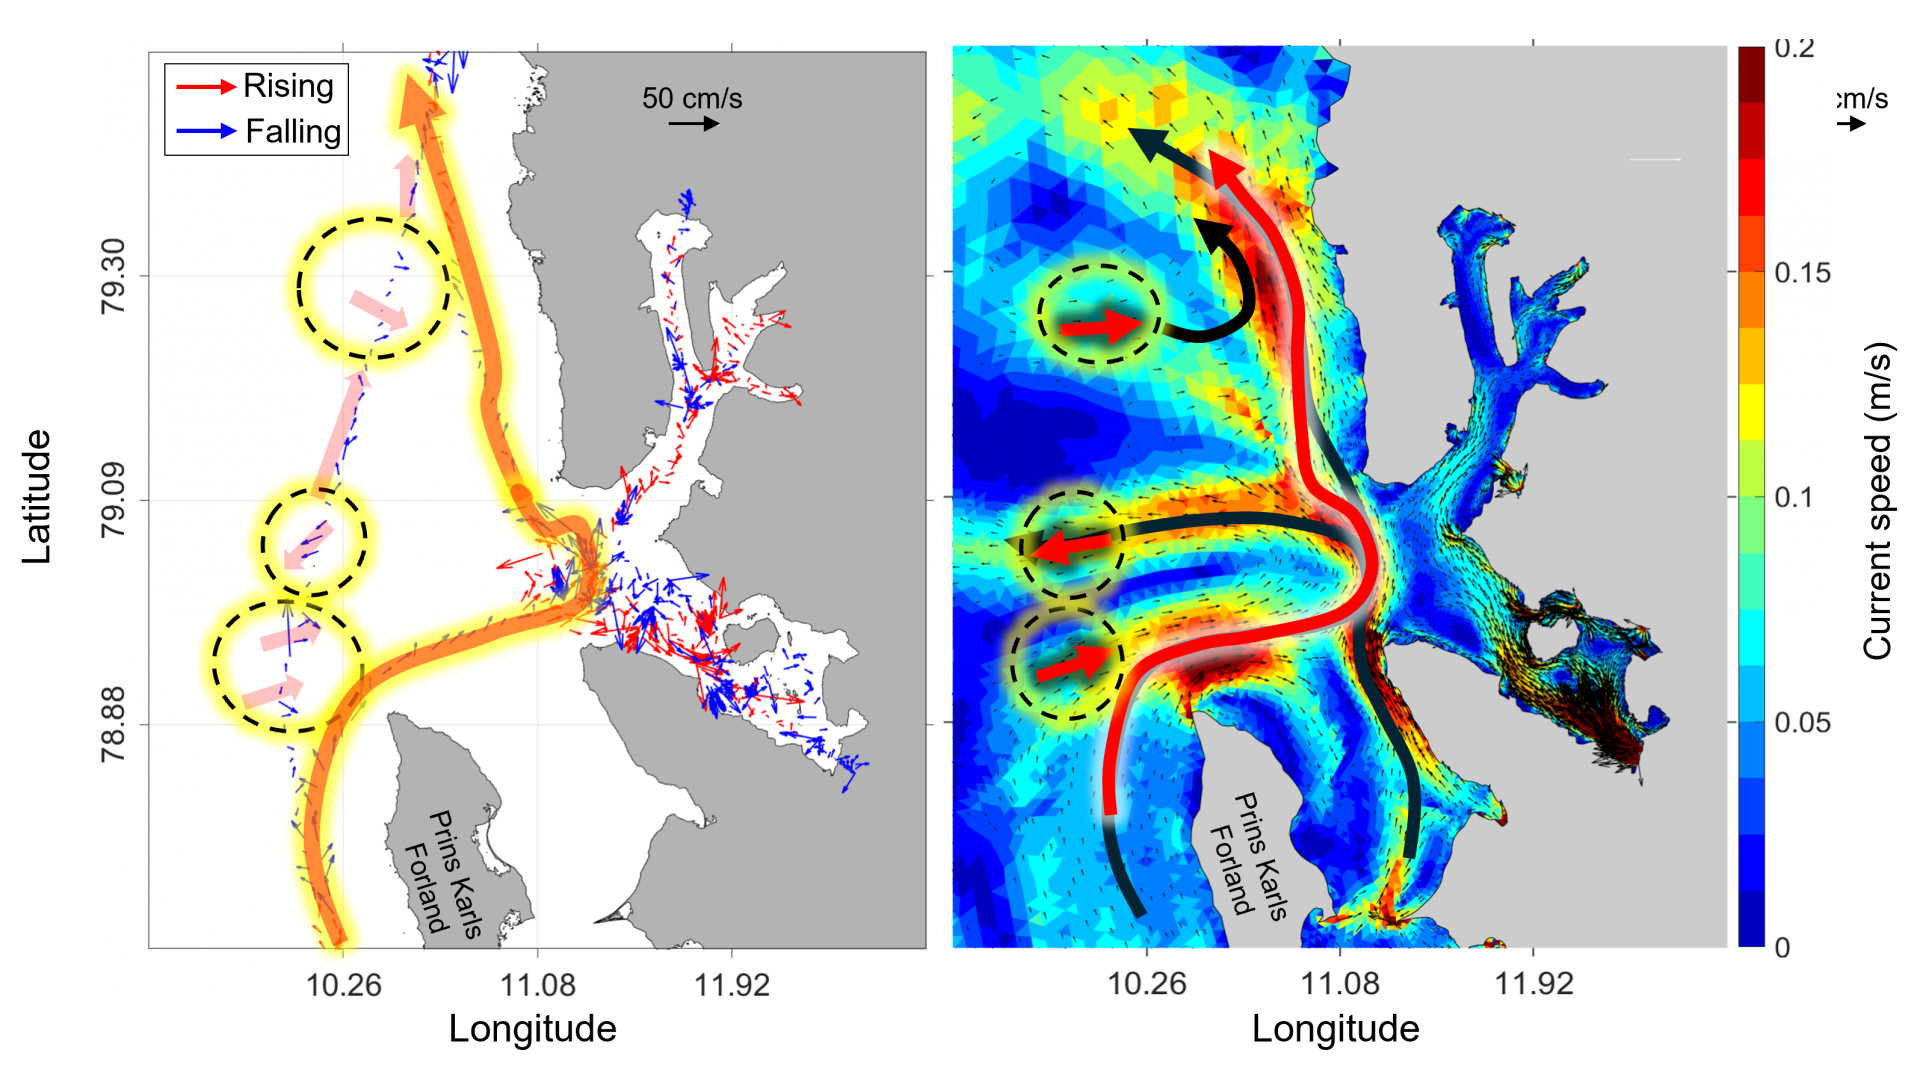
Figure 3. Comparison of observed and modeled current patterns in Kongsfjorden. The left panel shows ADCP observed current in July 2023. Current vector in rising tide (red arrow) and falling tide (blue arrow). The right panel shows monthly mean surface current distribution of model data in July 2007. The current speed (color scale, in m/s), and direction (black arrow) of the currents. The yellow dashed circles highlight areas of the comparison between observed and modeled data.
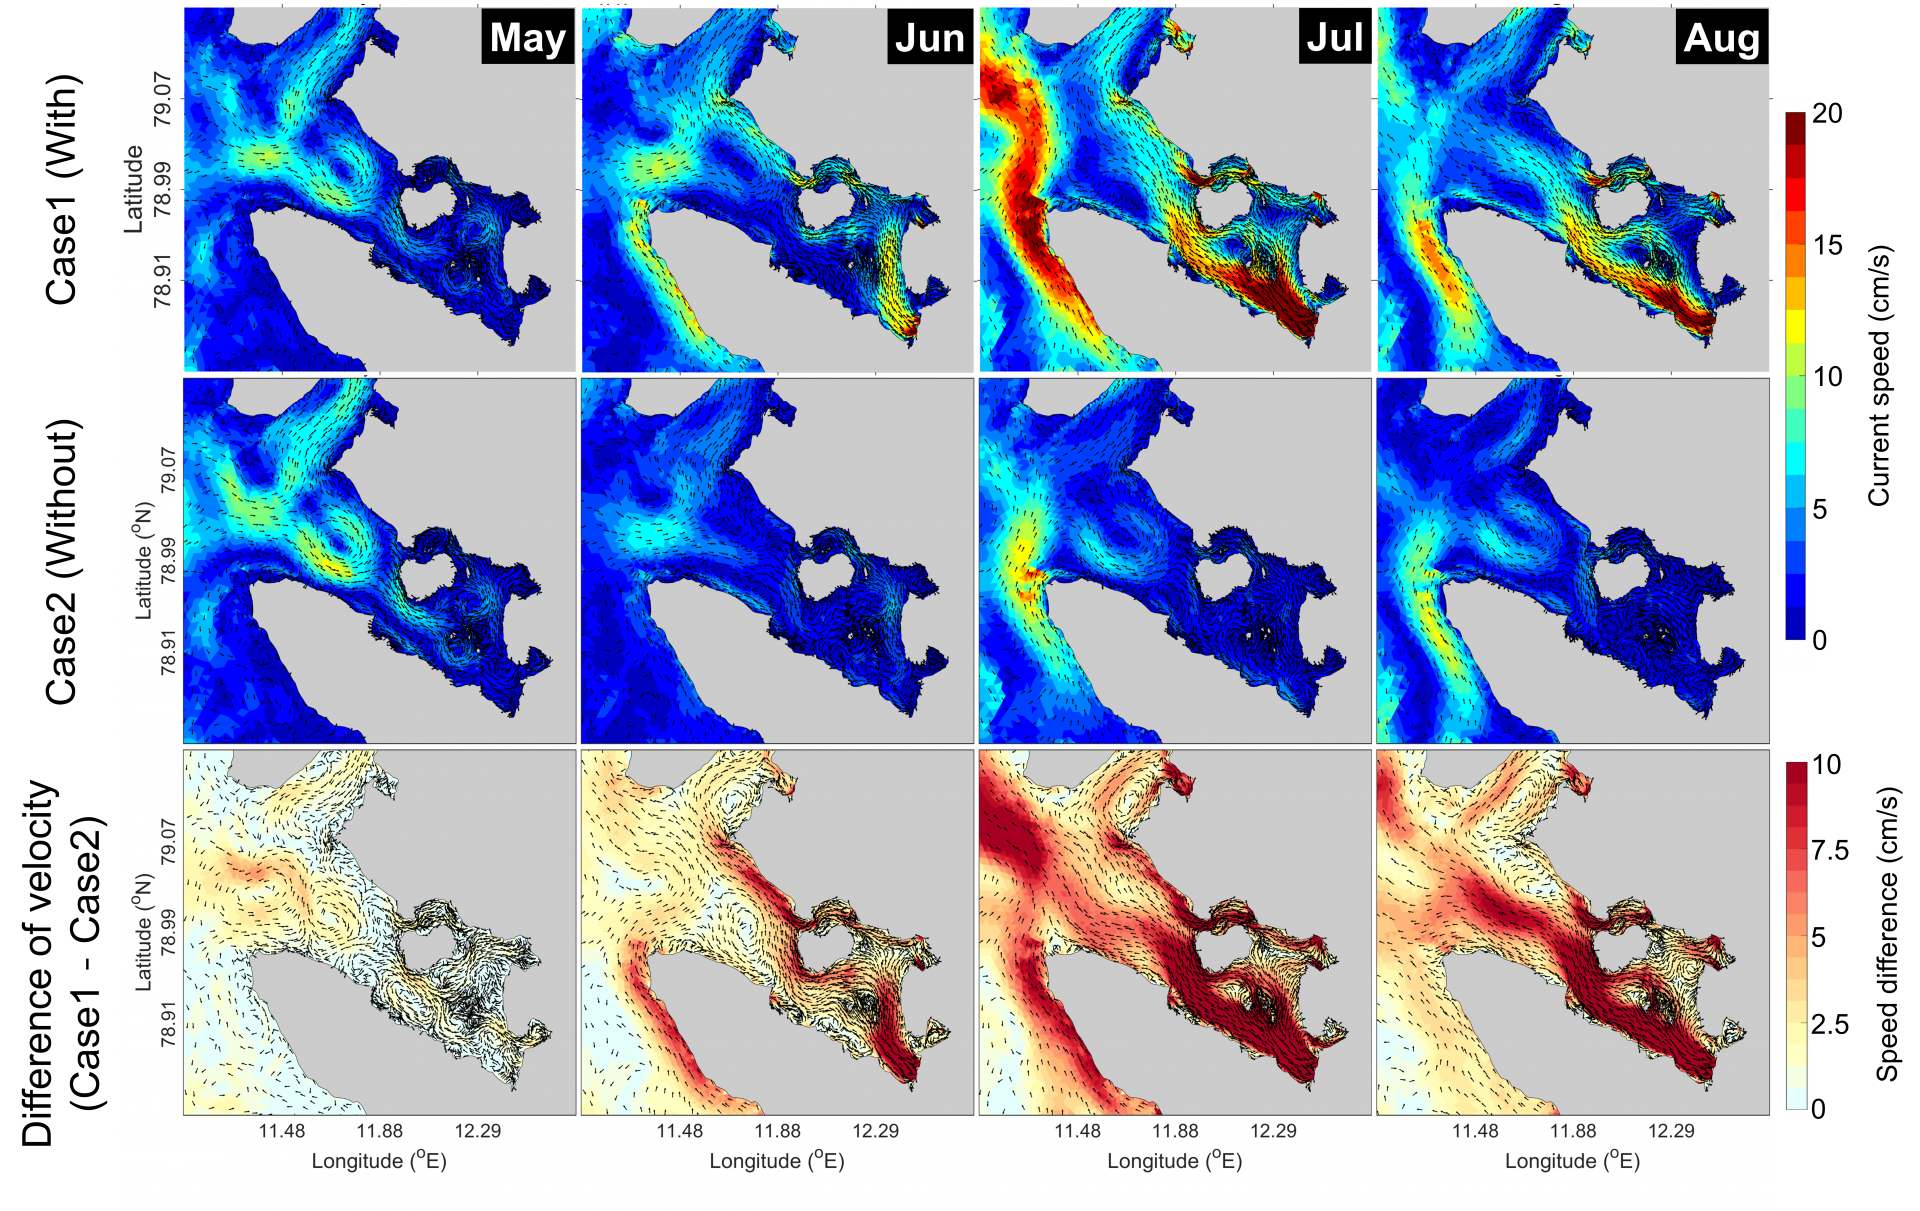
Figure 4. Distribution of monthly mean current at 0 m depth in Kongsfjorden. Current speed (color scale) and current direction (black arrows). The upper panels show the case1 model results. The middle panels show the case2 model results. The lower panels show the current vector difference between case1 and case2. From left to right, the panels represent the monthly mean current distribution for May, June, July, and August.
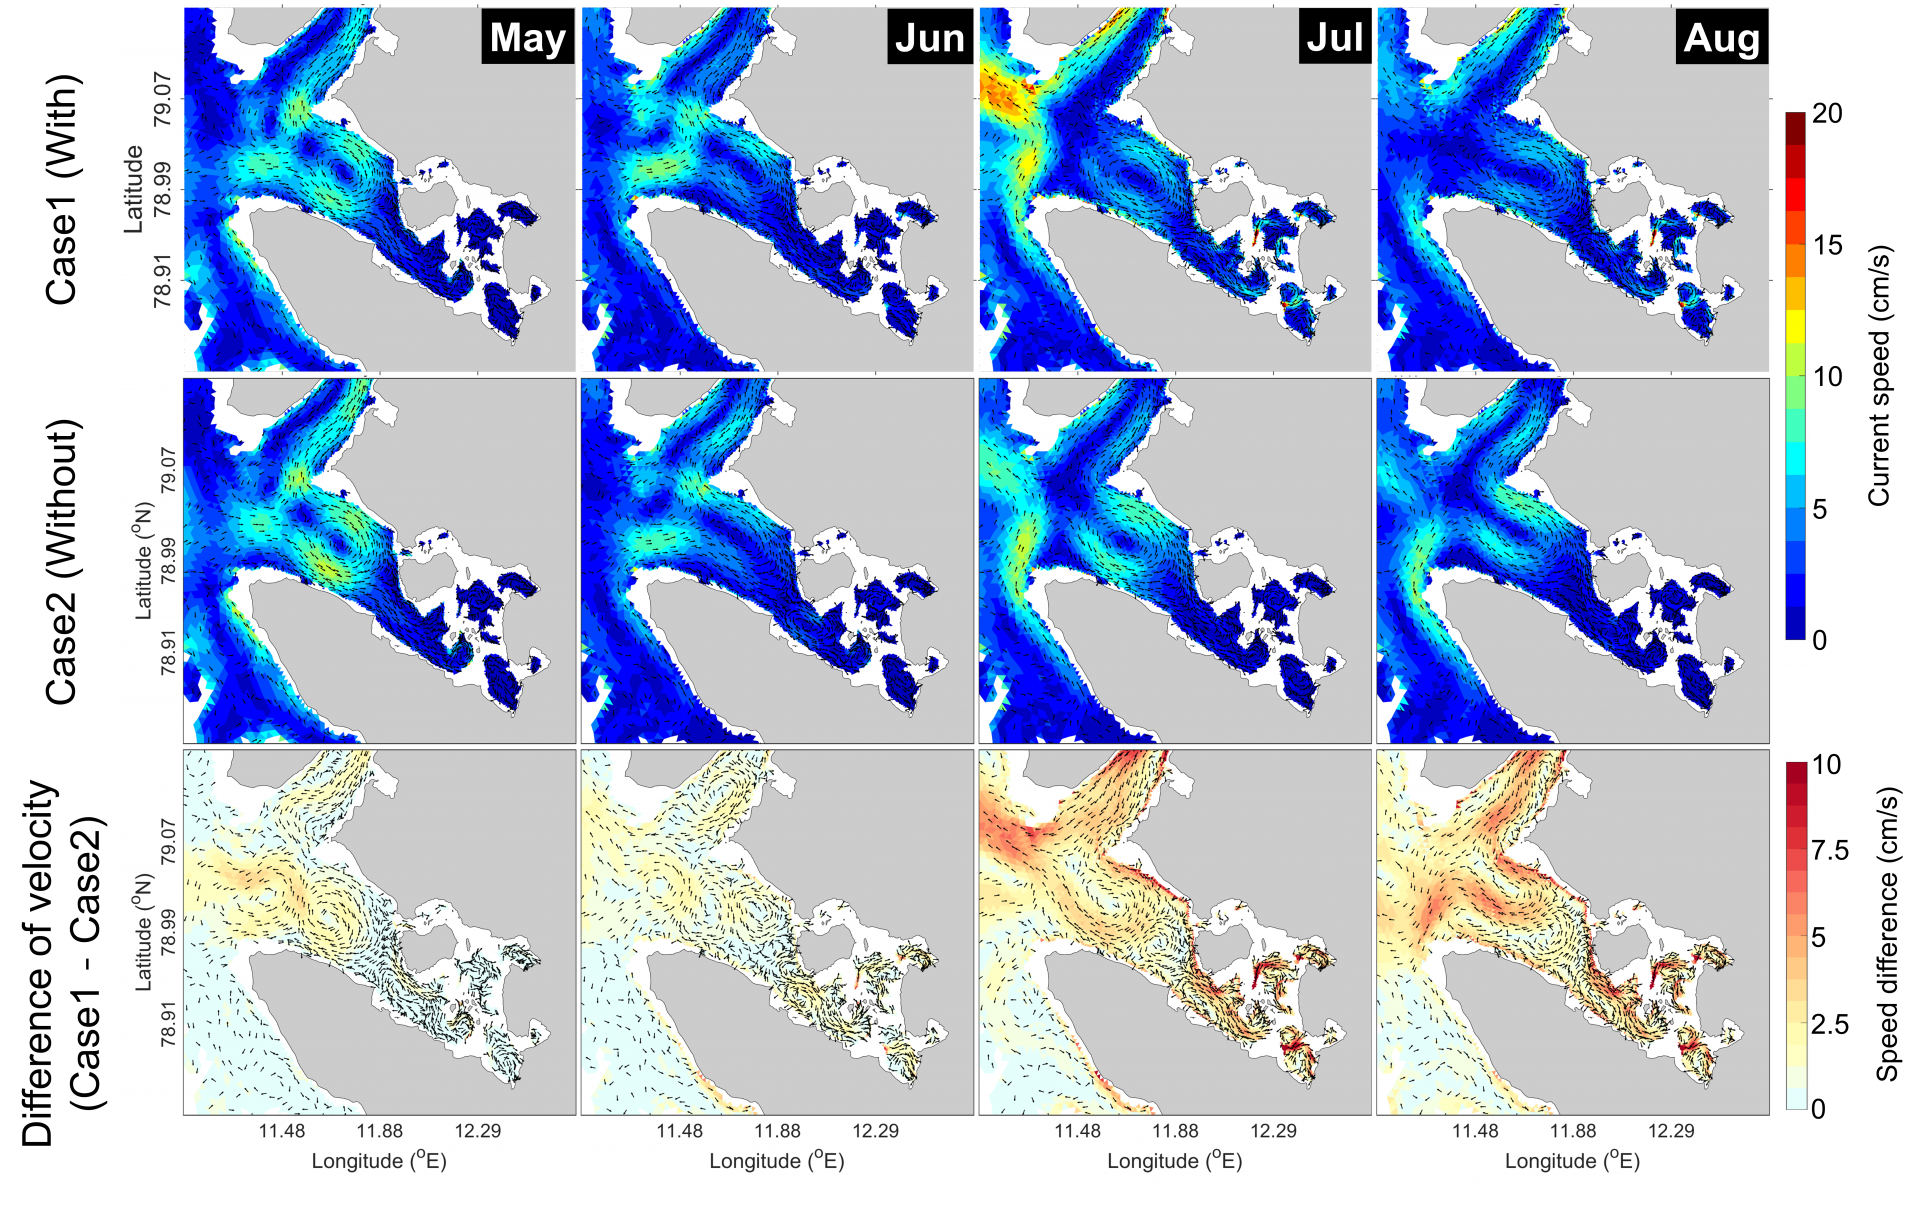
Figure 5. Distribution of monthly mean current at 50 m depth in Kongsfjorden. Current speed (color scale) and current direction (black arrows). The upper panels show the case1 model results. The middle panels show the case2 model results. The lower panels show the current vector difference between case1 and case2. From left to right, the panels represent the monthly mean current distribution for May, June, July, and August.
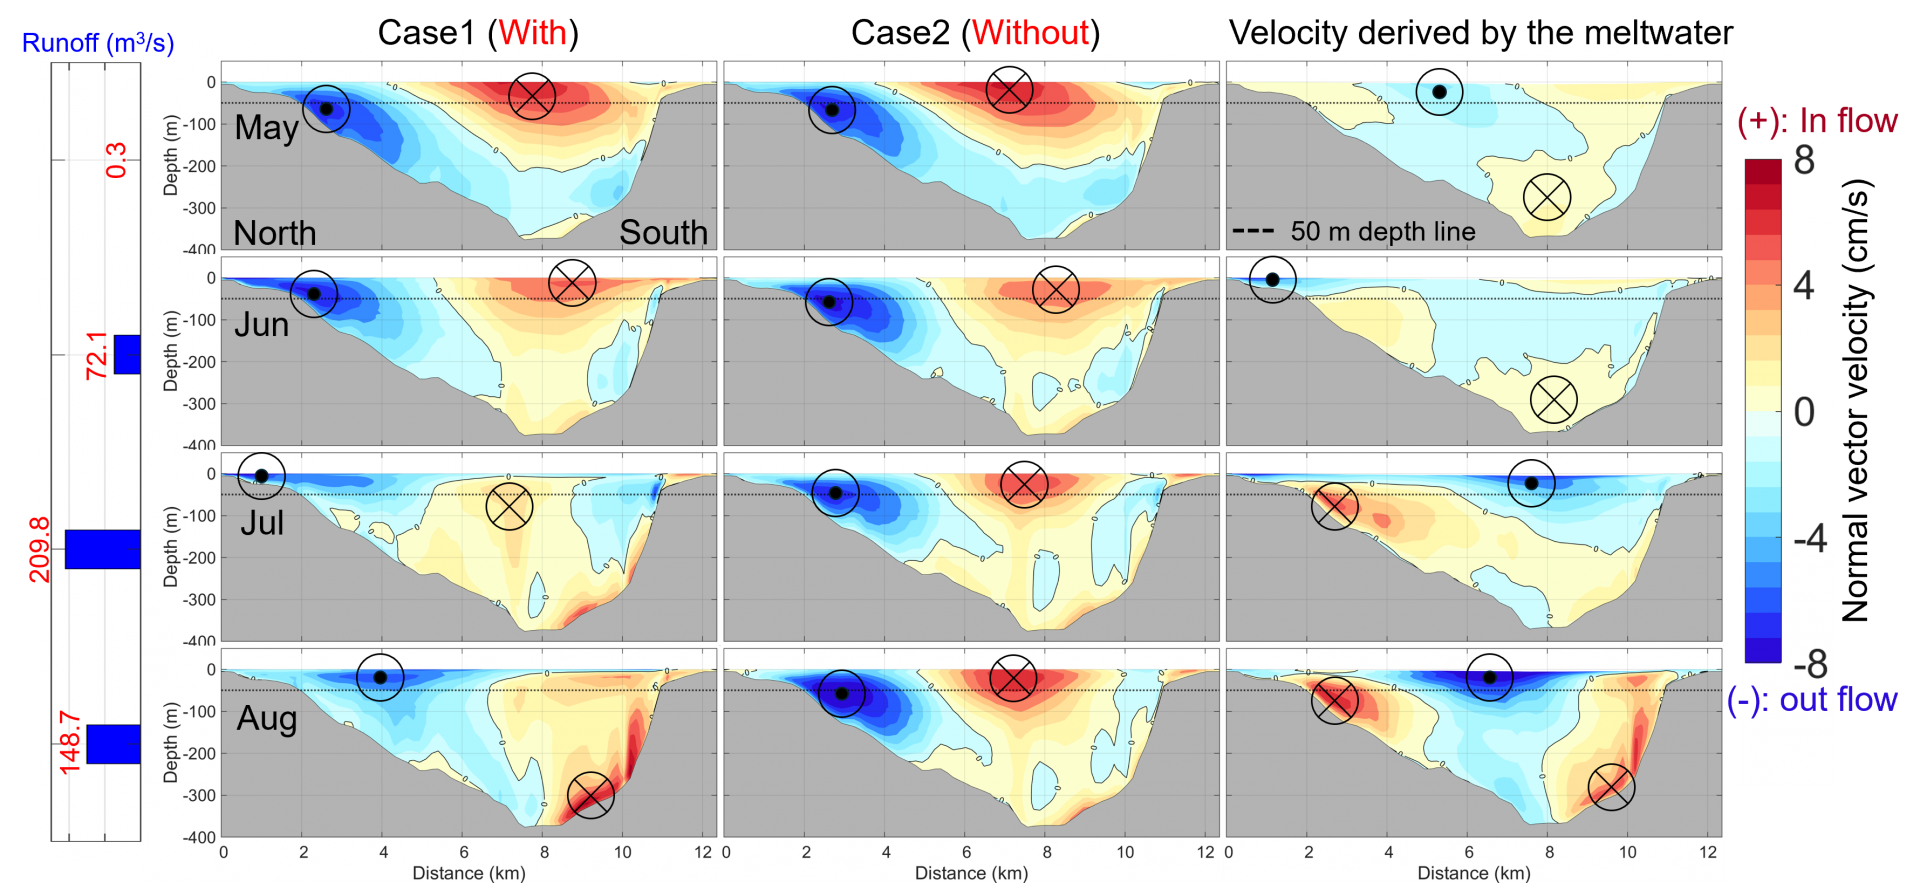
Figure 6. The monthly mean cross-transect velocity distribution at Kongsfjorden mouth. Positive values indicate inflow into Kongsfjorden, while negative values indicate outflow from Kongsfjorden. The Case 1 (left panel) and Case 2 (middle panel) model results. The difference in cross-transect velocity between Case1 and Case2 (Case1-Case2, right panel). Monthly mean distribution from the top panel to the bottom panel for May, June, July, and August. The 50 m depth line (The black dashed line). The zero-velocity contour (black solid line), where the velocity or velocity difference is 0 cm/s.
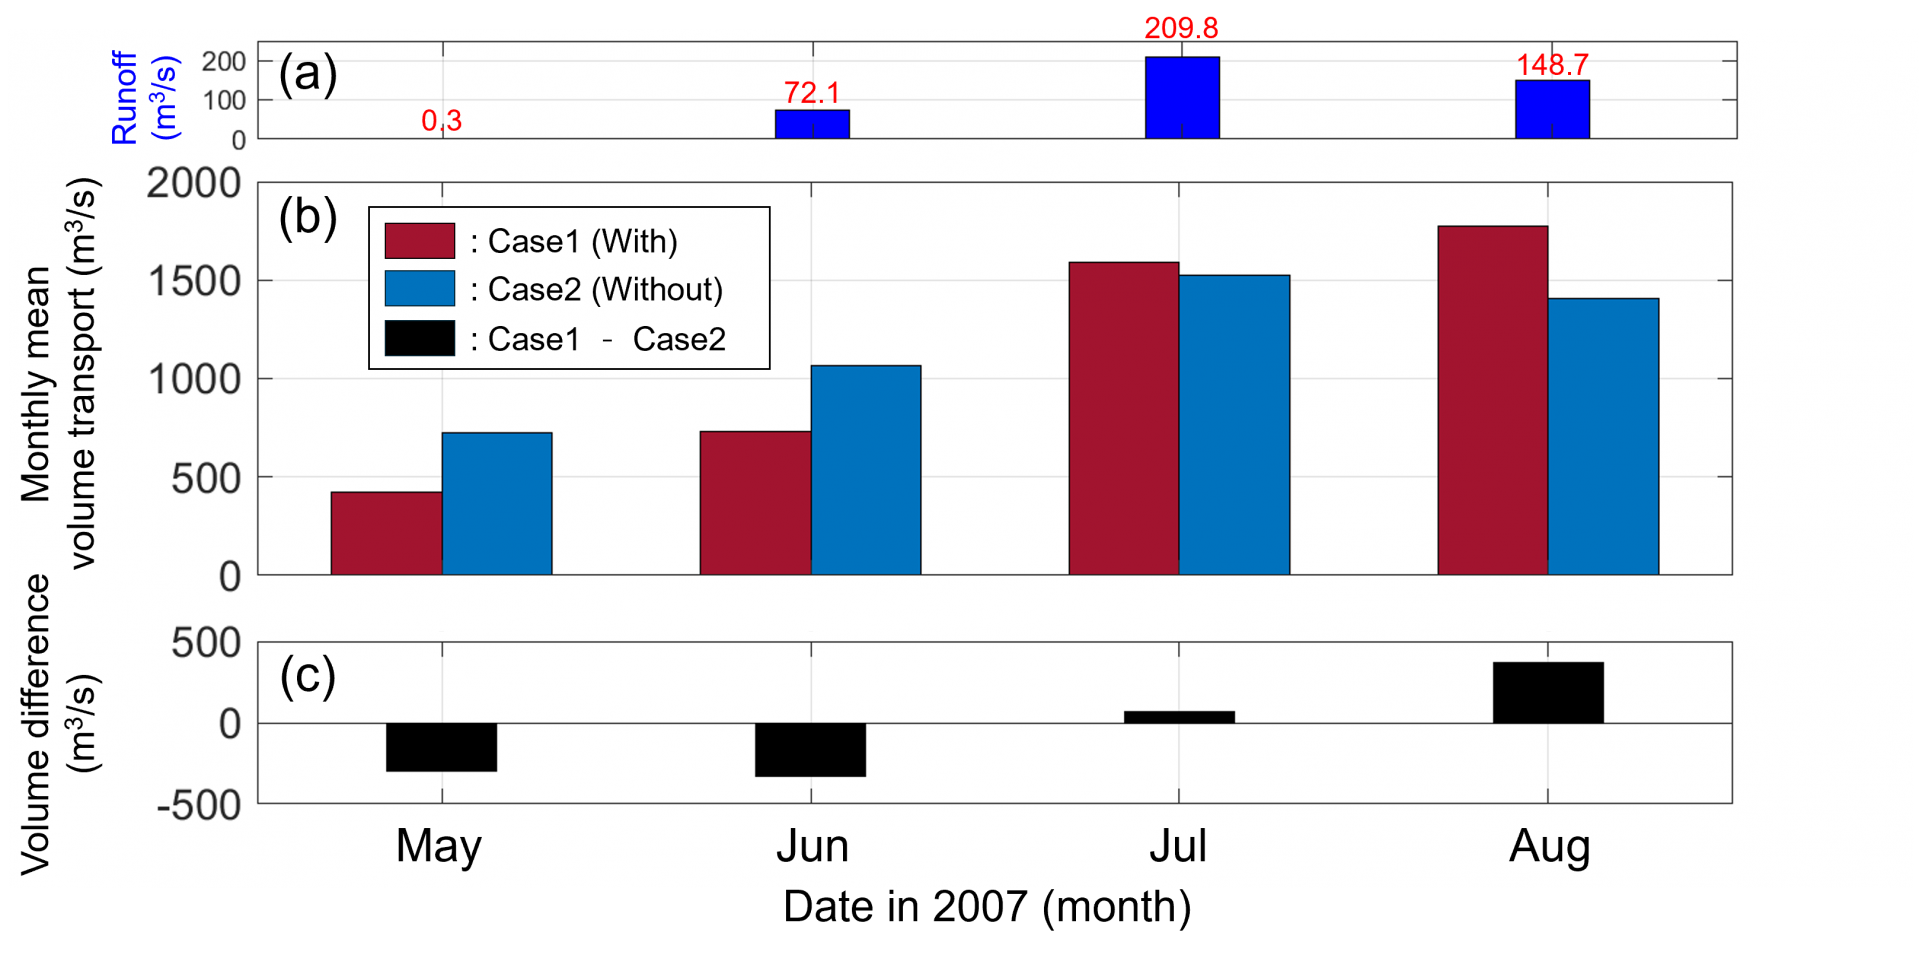
Figure 7. Monthly mean volume transport and runoff in Kongsfjorden. (a) Monthly mean runoff rates (in m³/s) for May, June, July, and August. (b) Monthly mean volume transport (in m³/s) with subglacial discharge included (Case 1, red bars) and without subglacial discharge (Case 2, blue bars). (c) The difference in volume transport between Case 1 and Case 2 (Case 1 - Case 2, black bars).
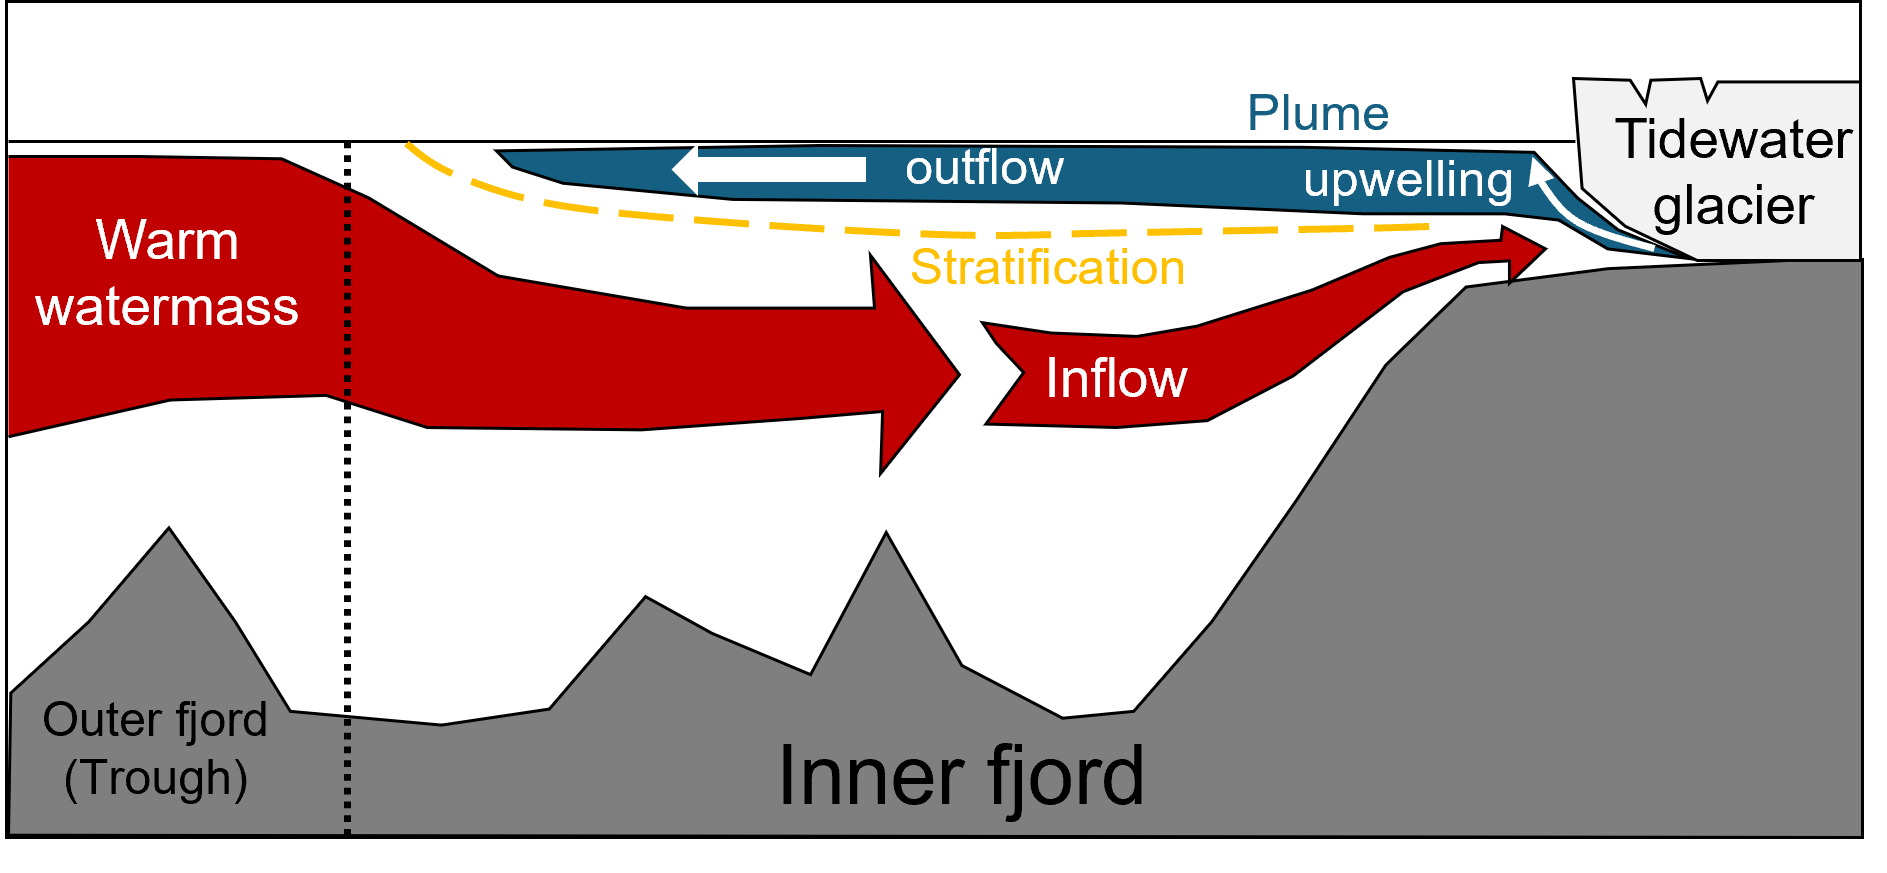
Figure 16. Schematic diagram about impact of meltwater runoff on flow pattern and sea water exchange process at fjord system. Bathymetry of trough and fjord (gray) and tidewater glacier (light gray) at fjord coastline. Mouth of fjord (black dashed line) Plume (blue area), upwelling (thine white arrow) and outflow (thick white arrow) induced by sub-surface meltwater runoff. Stratification (yellow dashed line) between fresher upper layer and salty lower layer.
- 사업명
- 북극 관문 피오르드·연안 해역의 과거와 현재 해류 및 퇴적물 거동 특성
- 발주처
- 극지연구소