
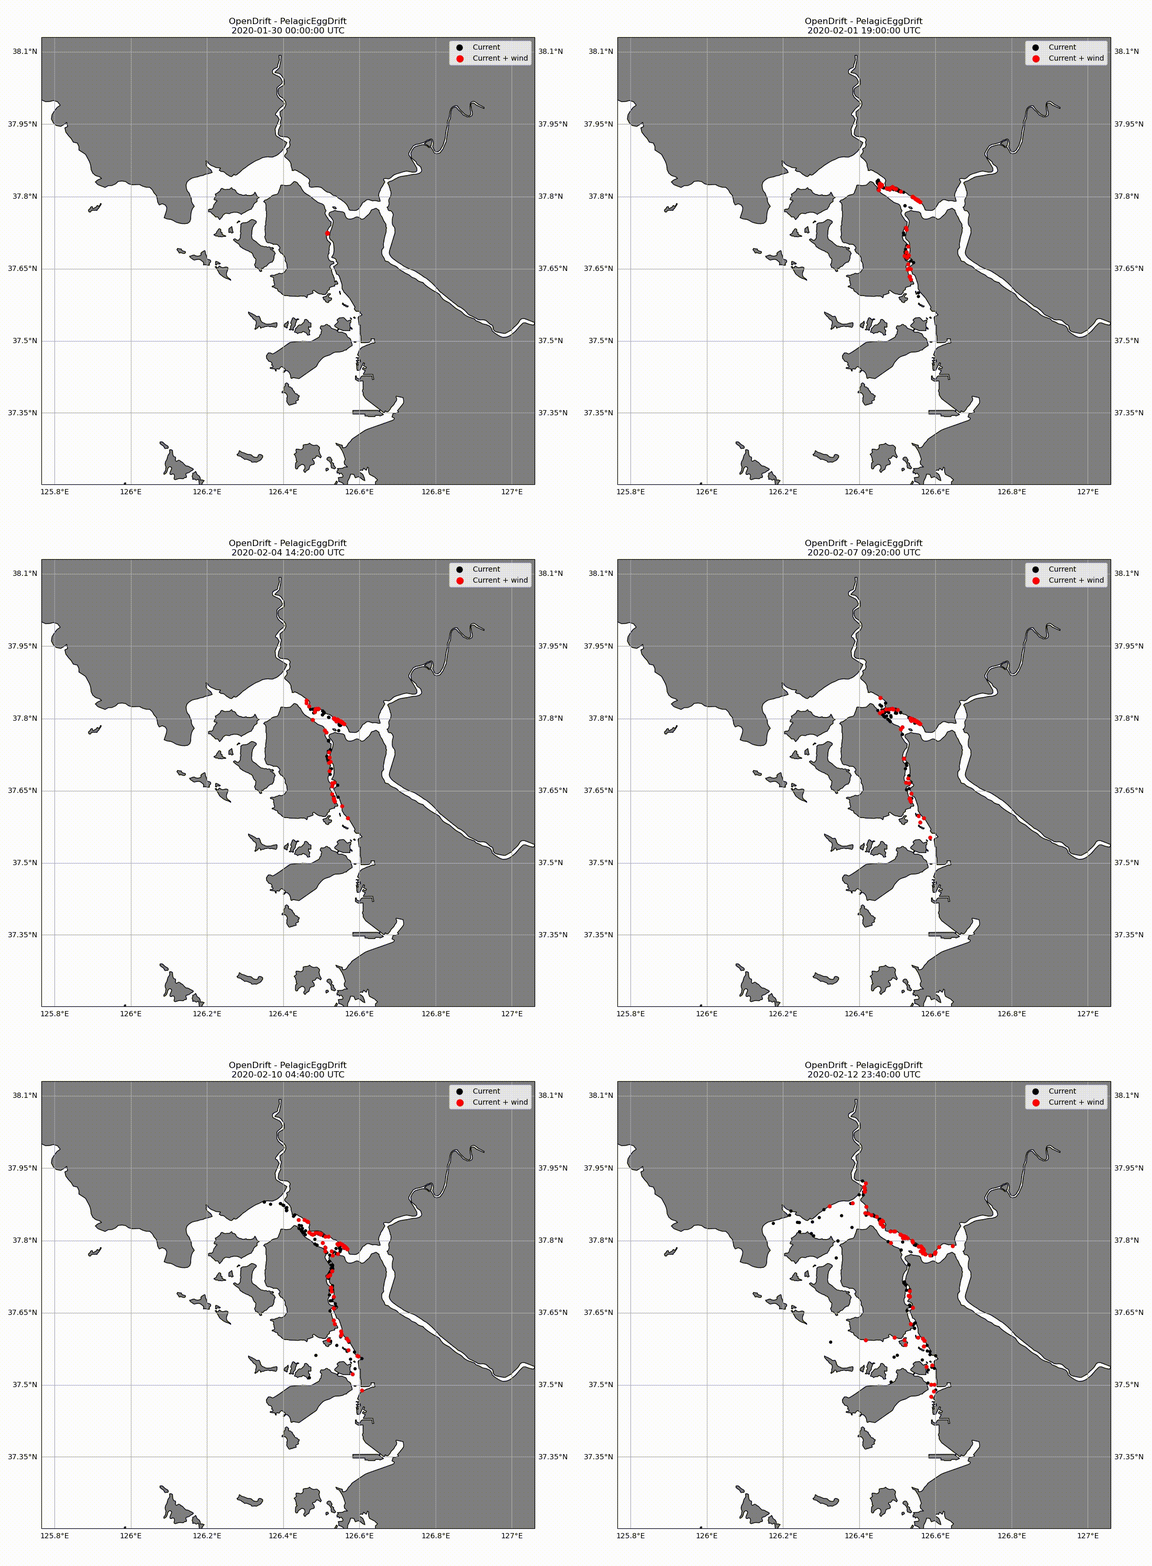
Figure 1. Particle tracking was performed using the Opendrift model. A video comparing when considering only the current and when considering the wind as well. The simulation period is 2020-01-30 to 2020-02-12, and the calculation time interval is 20 minutes. The black dots are the result of considering only the flow speed, and the red dots are the result of considering both the flow speed and wind. The base flow data uses the results of the FVCOM model.
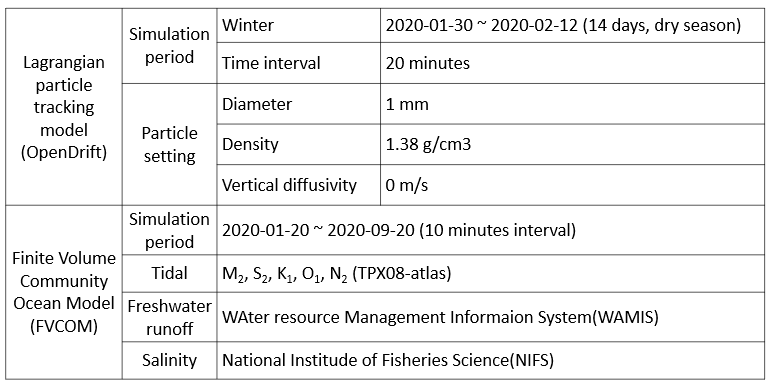
Table 1. Model configurations
- 사업명
- 한강하구 쓰레기 거동 특성 분석 및 저감 방안 연구용역
- 발주처
- 인천광역시