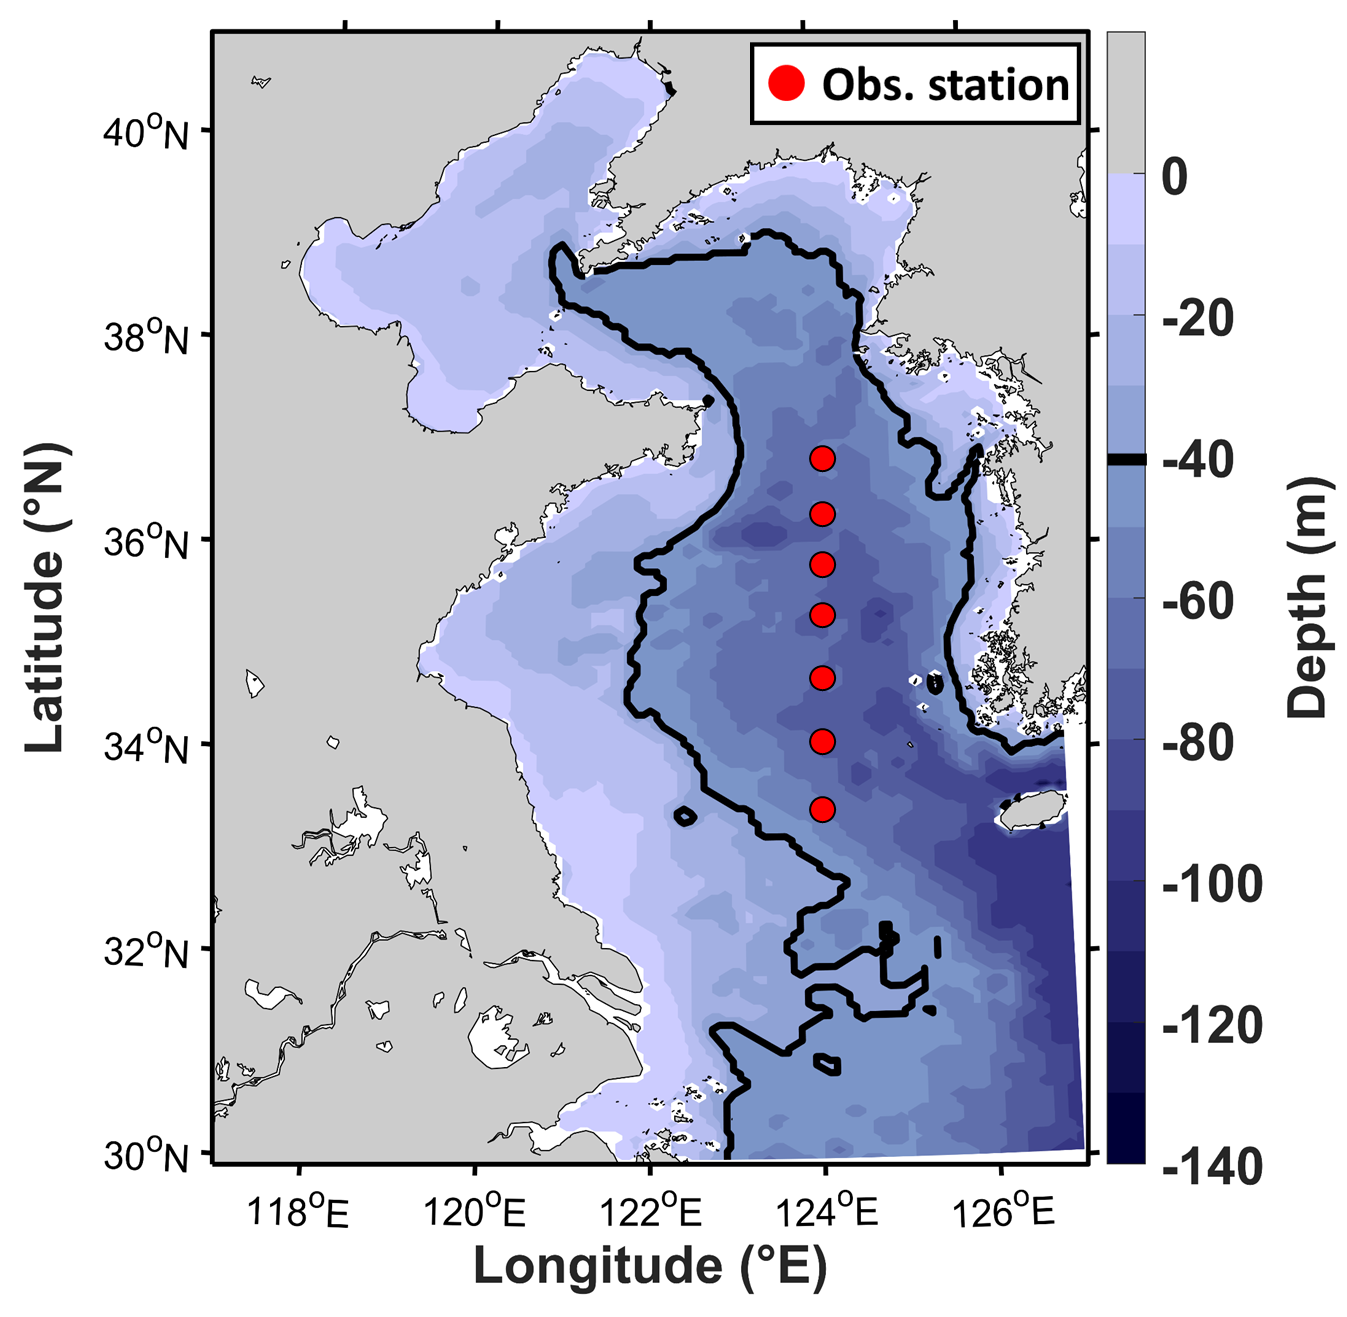
Figure 1. Bathymetry map of Hybrid Coordinate Ocean Model (HYCOM) in the Yellow Sea. The black line indicates the 40-m depth contour. The red dots are the observation station from National Institute of Fisheries Science (NIFS) serial oceanographic observations.
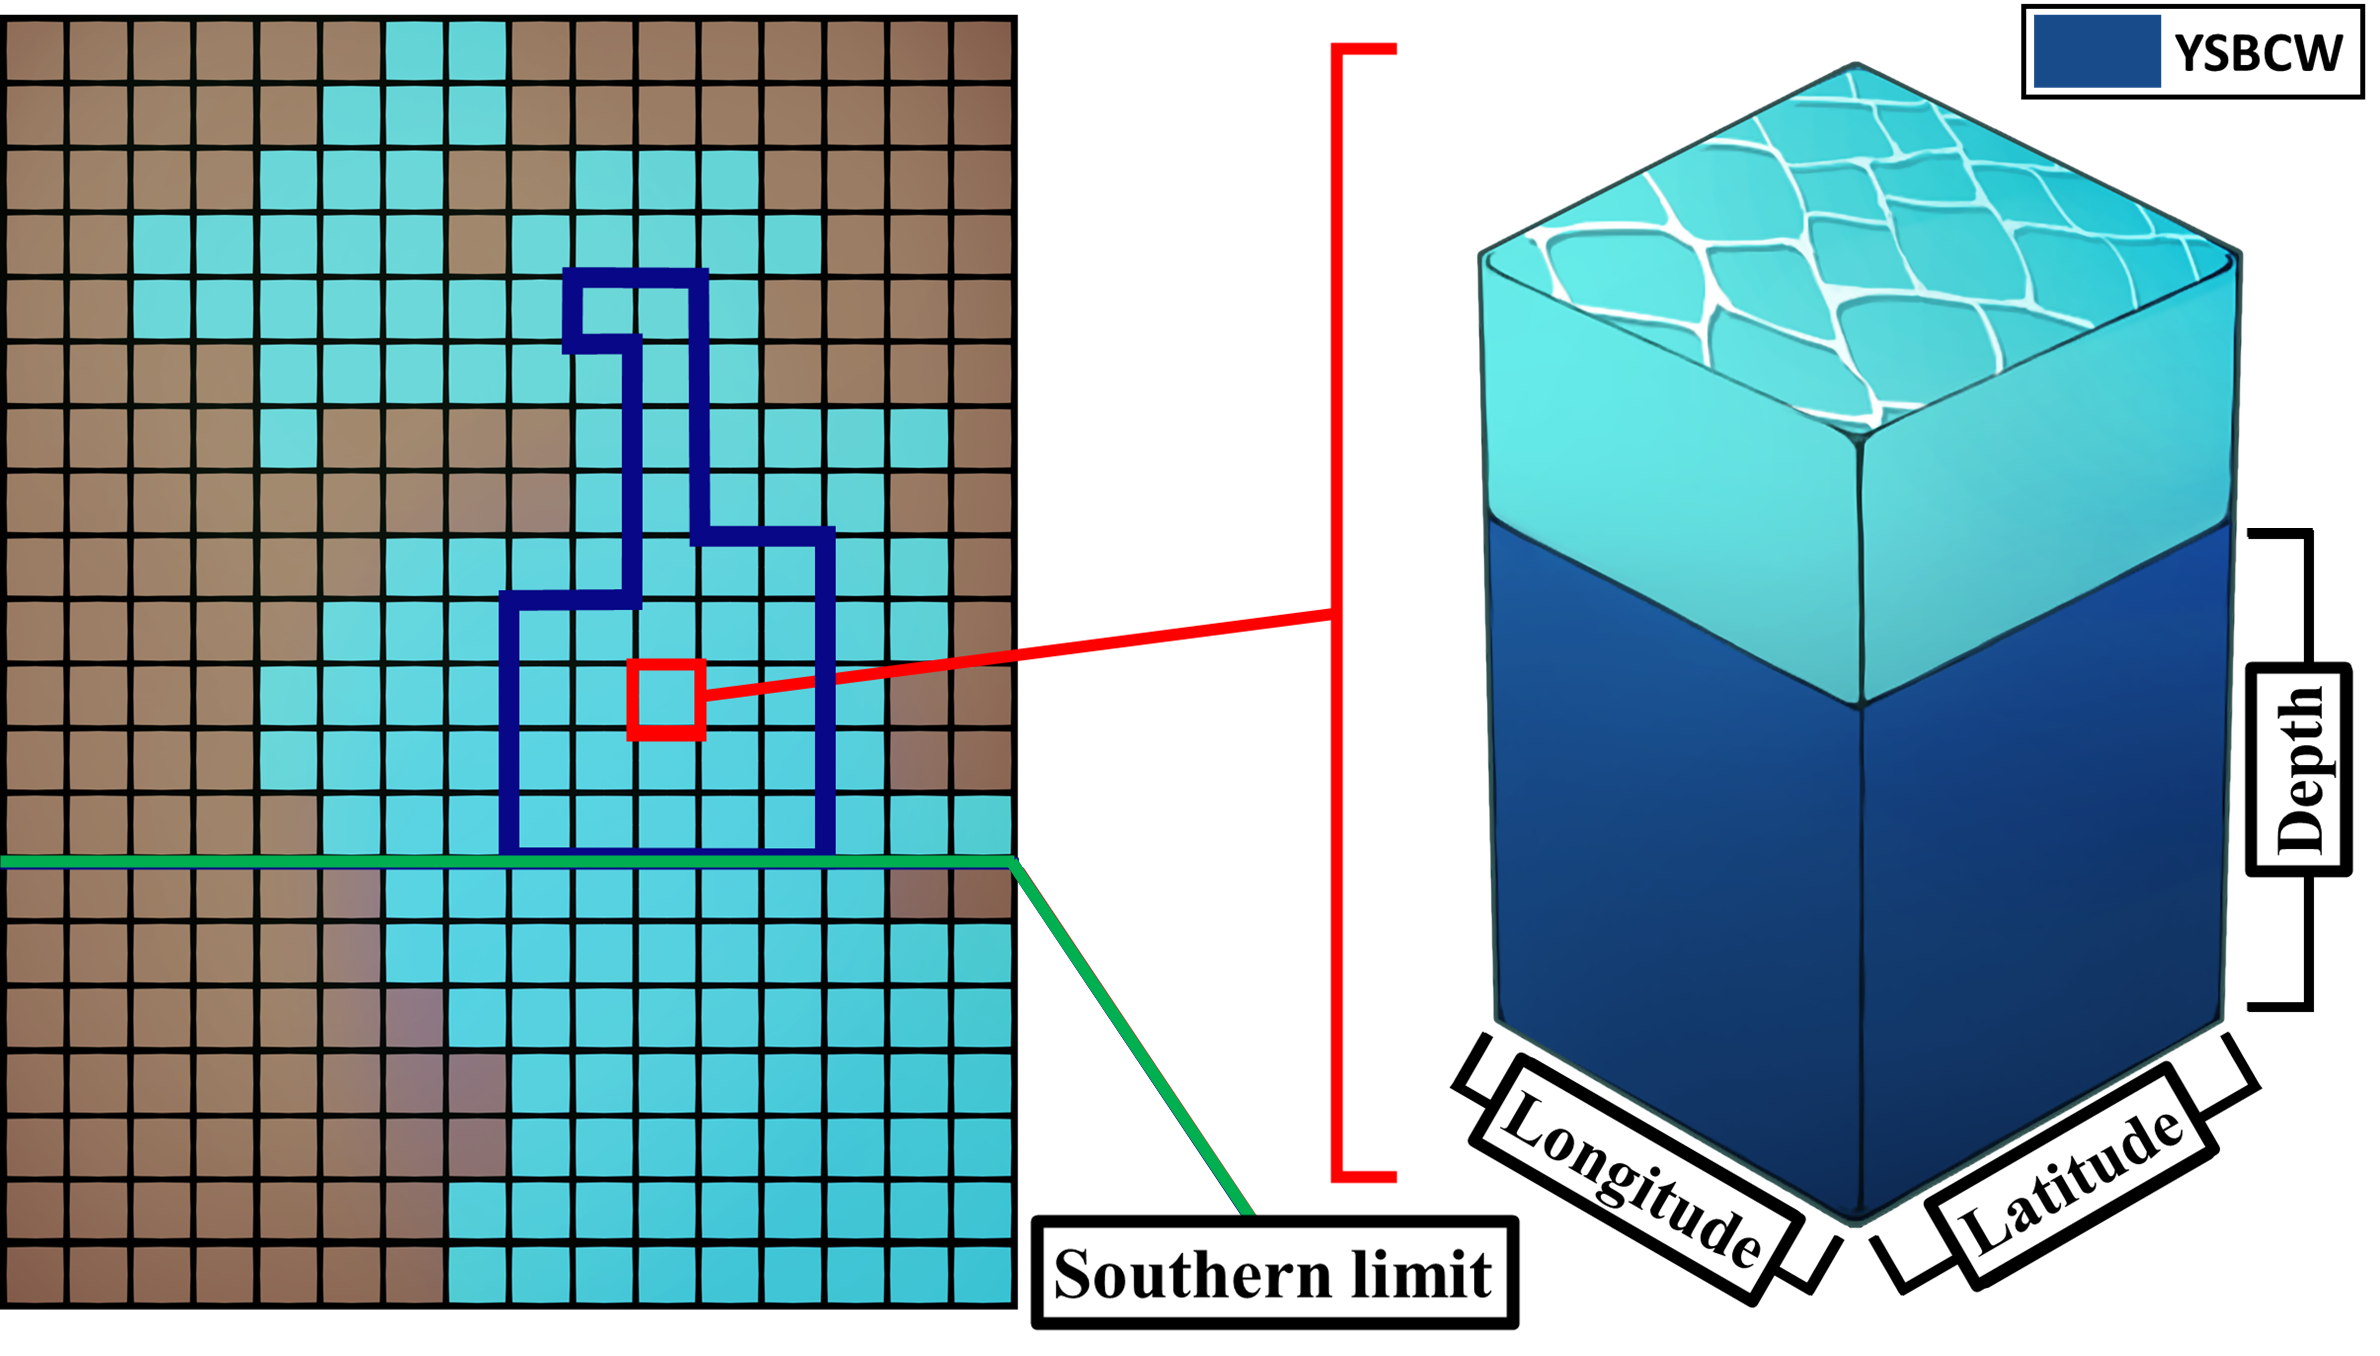
Figure 2. A simplified schematic for calculating the volume of Yellow Sea Bottom Cold Water (YSBCW). The blue bounding box shows the cells that contain the YSBCW. The green horizontal line is the southern limit of the YSBCW. The right panel shows the volume of YSBCW in one cell.
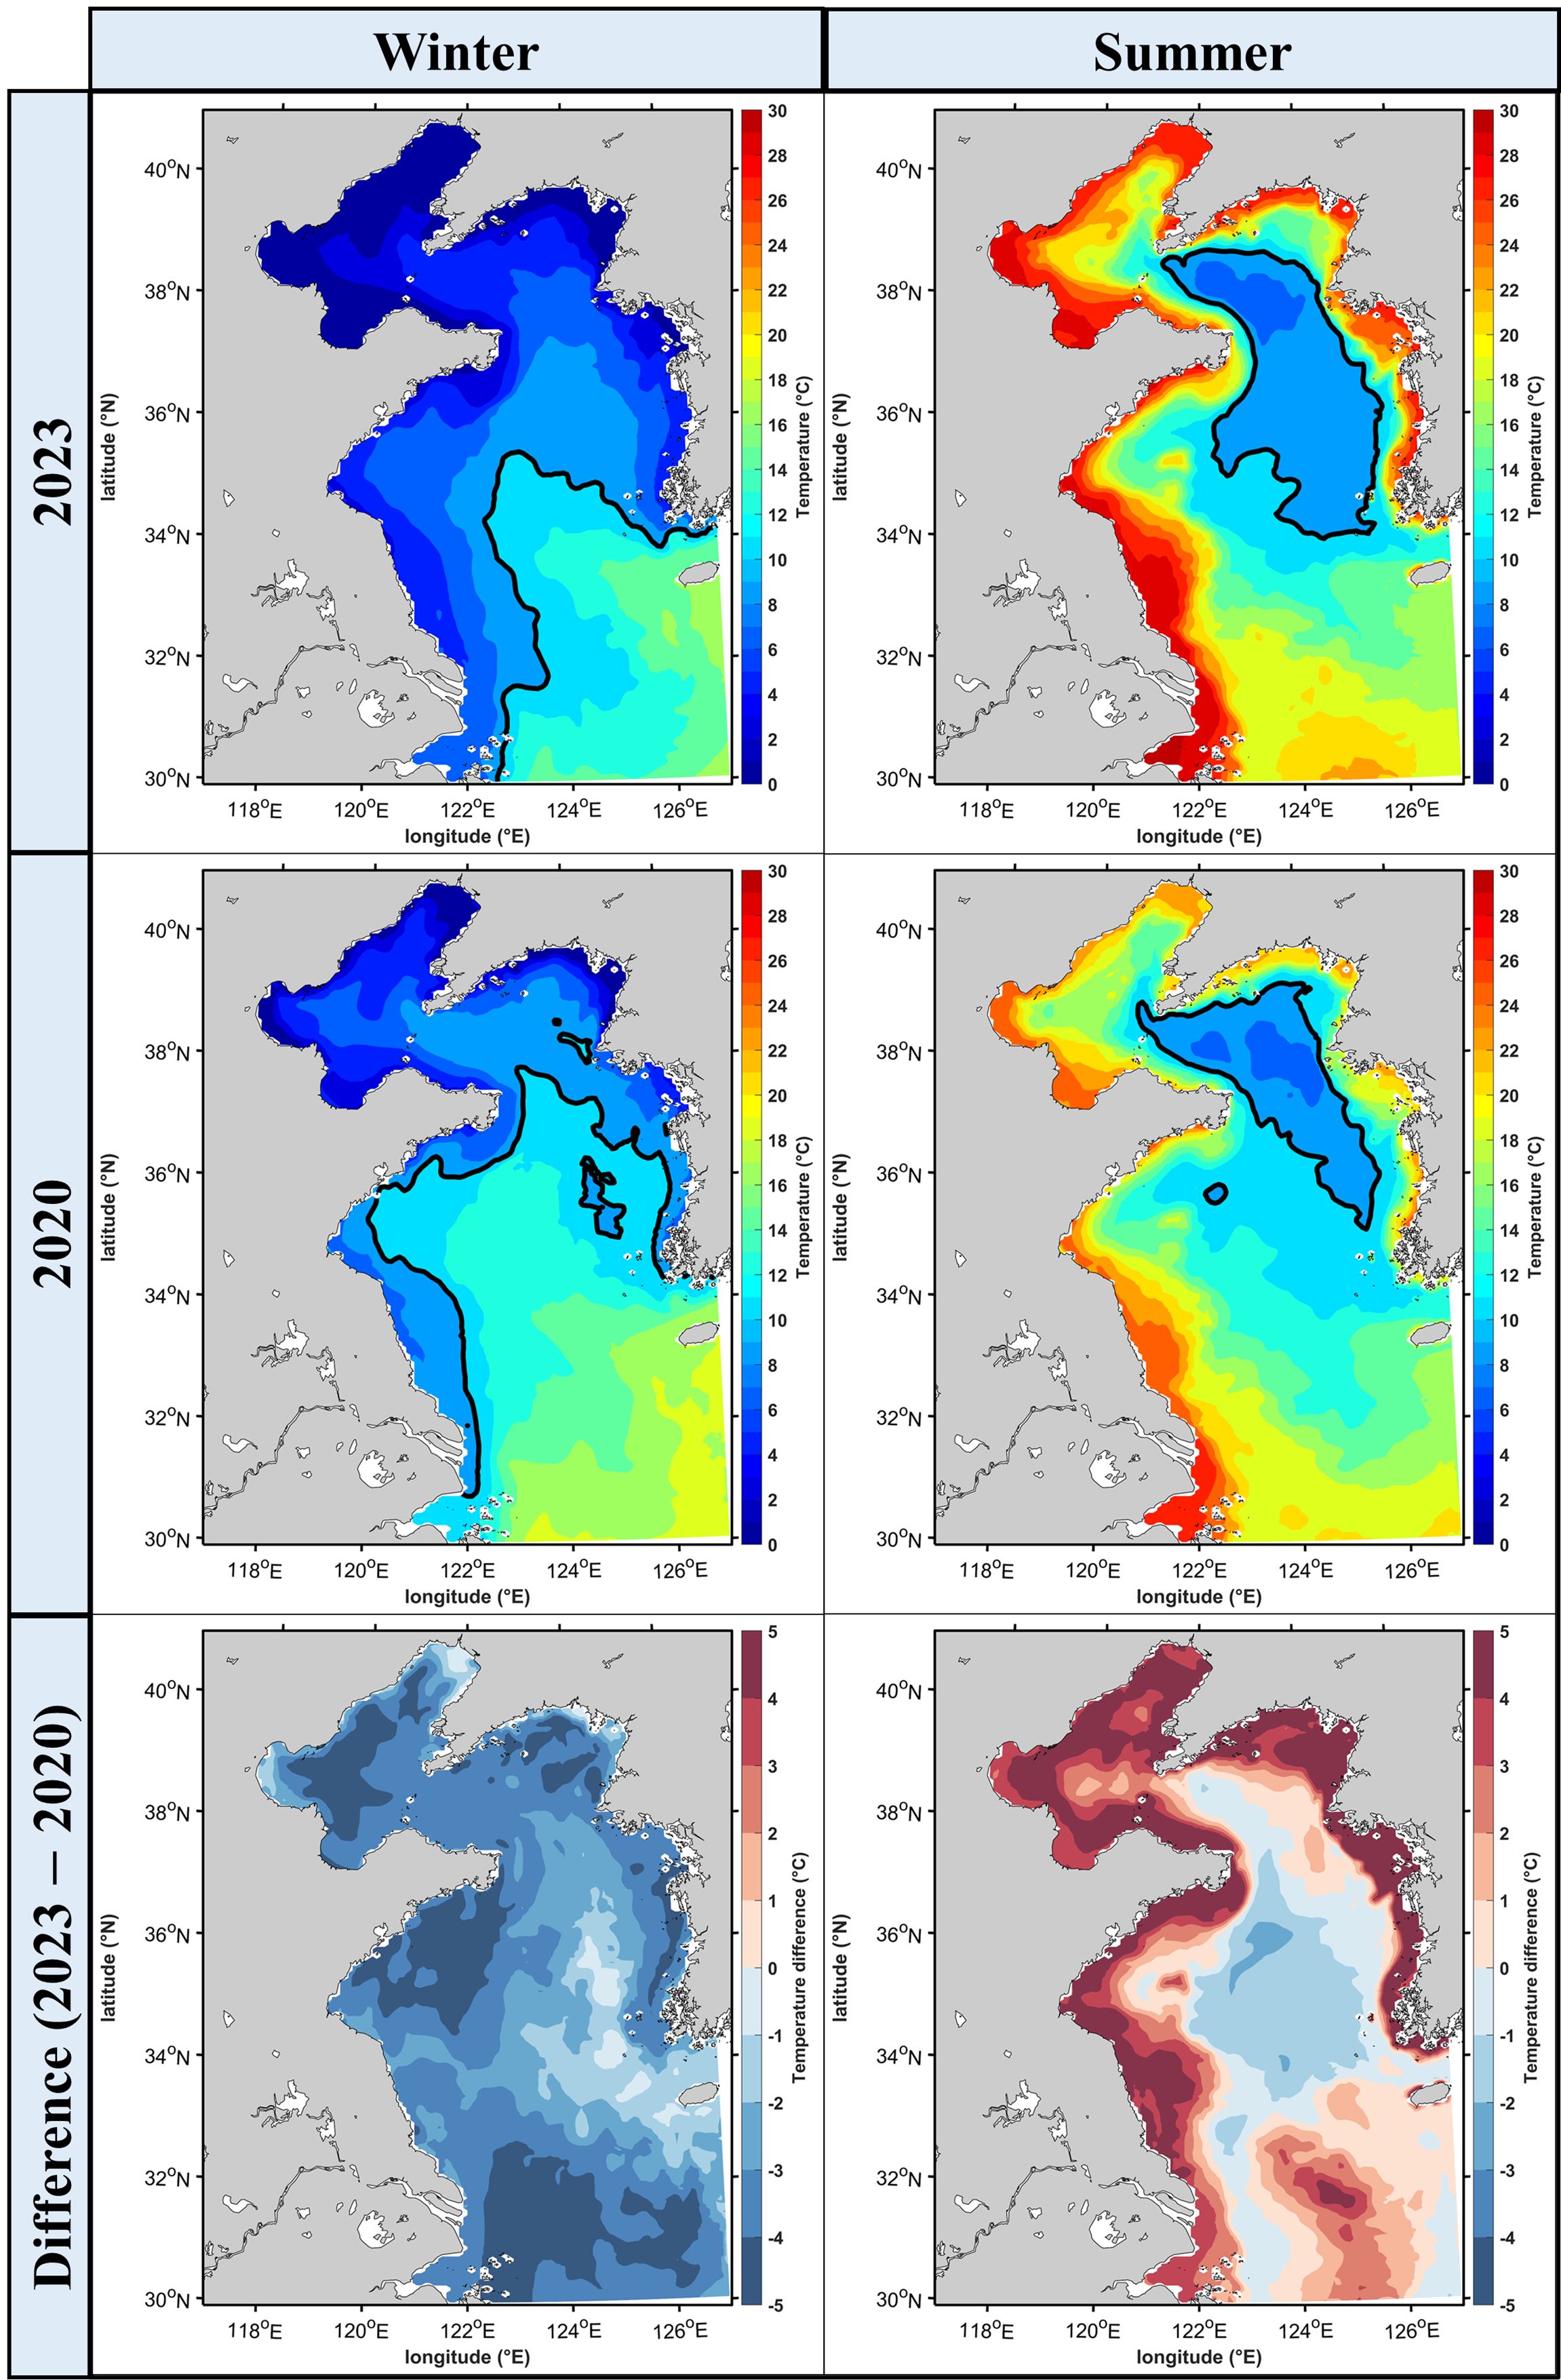
Figure 3. (a) and (c) represent the average bottom water temperature for January and February (winter) in 2023 and 2020, respectively. (b) and (d) represent the average bottom water temperature for July and August (summer) in 2023 and 2020, respectively. (e) and (f) represent the differences in bottom water temperature during the winter and summer between 2023 and 2020. The black line is the 10 deg C contour. In winter 2023, the bottom water temperature was lower. In summer 2023, the bottom water temperature was lower in the open sea, but near the coast was higher.
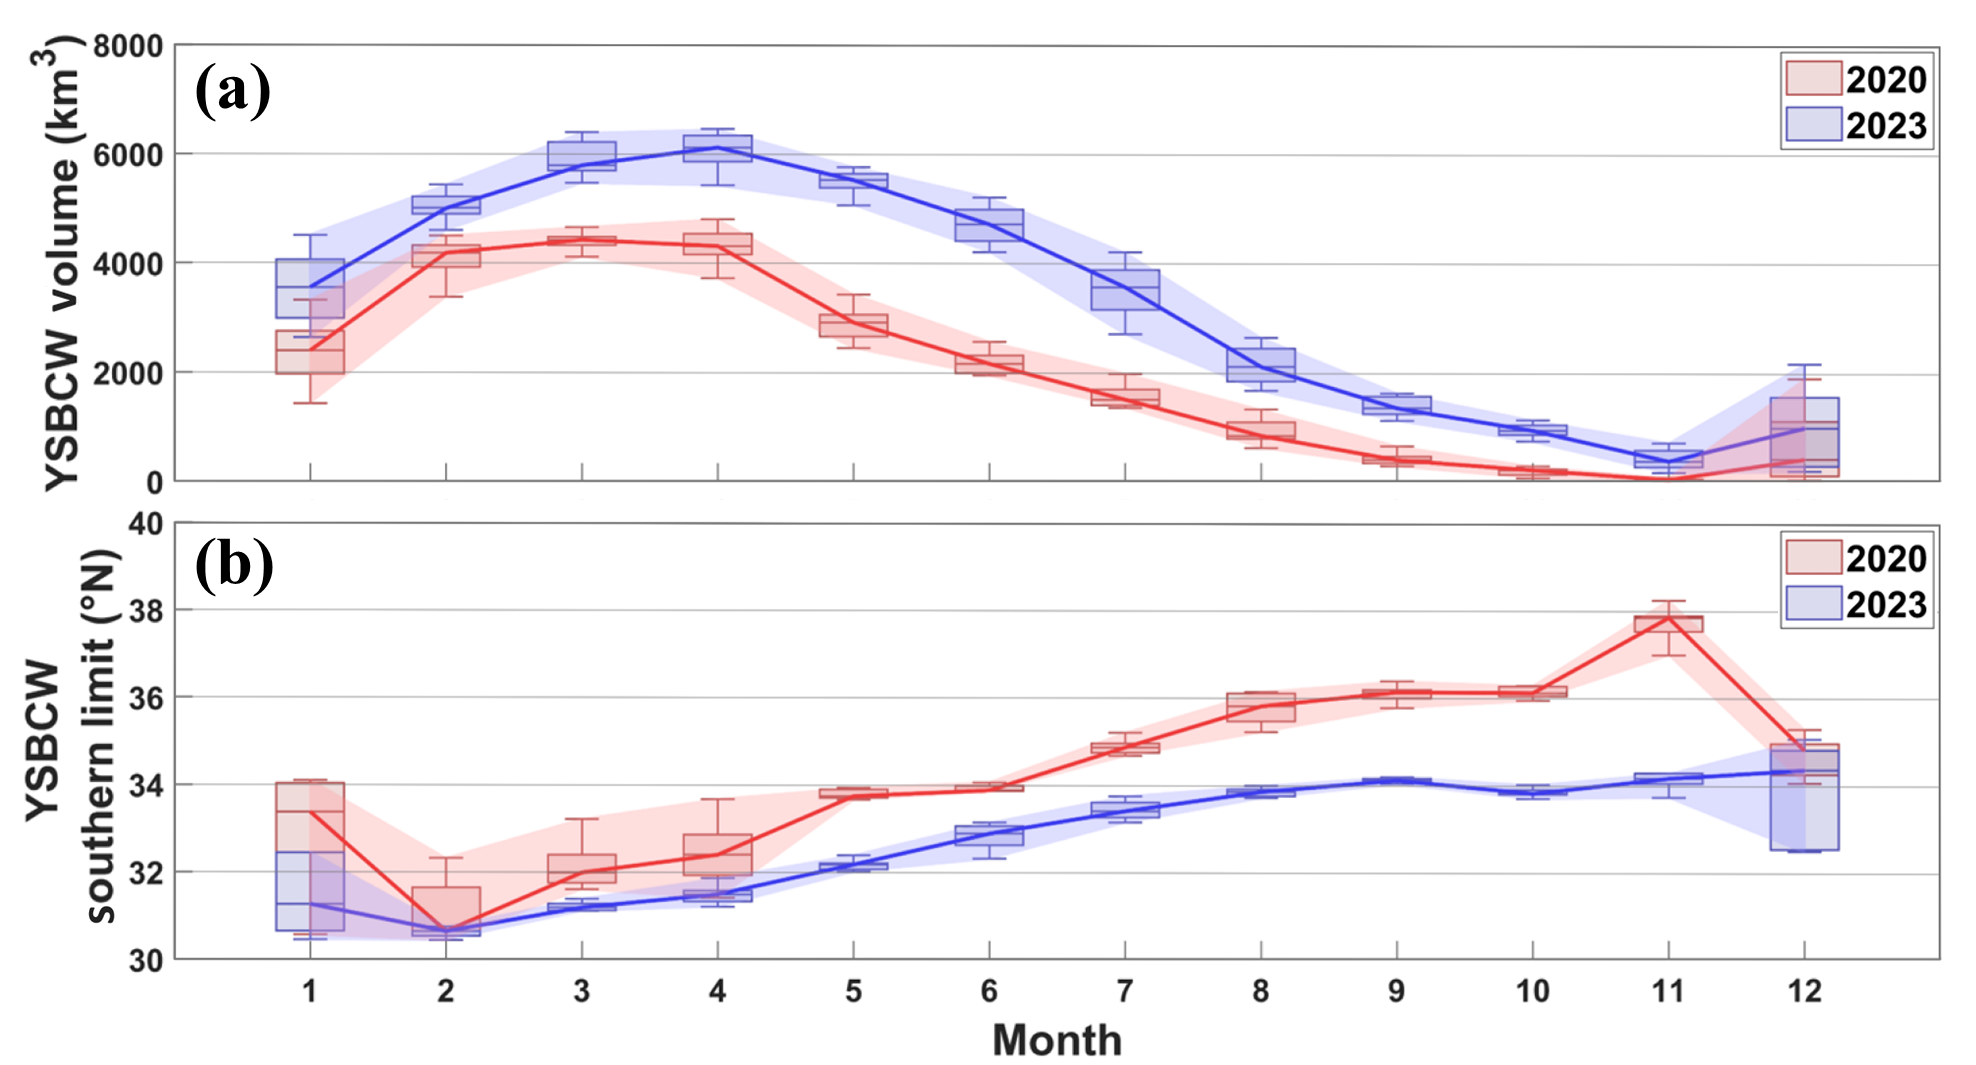
Figure 4. (a) represent the monthly YSBCW volume variation in 2023 and 2020, and (b) represent the monthly YSBCW southern limit variation in 2023 and 2020. In 2023, there was more YSBCW volume compared to 2020, and the southern limit of YSBCW extended southward compared to 2020.
- Project
- Sea Grant Program (Phase 5)
- Funded by
- Ministry of Oceans and Fisheries